Alcoa 2013 Annual Report Download - page 2
Download and view the complete annual report
Please find page 2 of the 2013 Alcoa annual report below. You can navigate through the pages in the report by either clicking on the pages listed below, or by using the keyword search tool below to find specific information within the annual report.-
 1
1 -
 2
2 -
 3
3 -
 4
4 -
 5
5 -
 6
6 -
 7
7 -
 8
8 -
 9
9 -
 10
10 -
 11
11 -
 12
12 -
 13
13 -
14
-
15
-
16
-
17
-
18
-
19
-
20
-
21
-
22
-
23
-
24
-
25
-
26
-
27
-
28
-
29
-
30
-
31
-
32
-
33
-
34
-
35
-
36
-
37
-
38
-
39
-
40
-
41
-
42
-
43
-
44
-
45
-
46
-
47
-
48
-
49
-
50
-
51
-
52
-
53
-
54
-
55
-
56
-
57
-
58
-
59
-
60
-
61
-
62
-
63
-
64
-
65
-
66
-
67
-
68
-
69
-
70
-
71
-
72
-
73
-
74
-
75
-
76
-
77
-
78
-
79
-
80
-
81
-
82
-
83
-
84
-
85
-
86
-
87
-
88
-
89
-
90
-
91
-
92
-
93
-
94
-
95
-
96
-
97
-
98
-
99
-
100
-
101
-
102
-
103
-
104
-
105
-
106
-
107
-
108
-
109
-
110
-
111
-
112
-
113
-
114
-
115
-
116
-
117
-
118
-
119
-
120
-
121
-
122
-
123
-
124
-
125
-
126
-
127
-
128
-
129
-
130
-
131
-
132
-
133
-
134
-
135
-
136
-
137
-
138
-
139
-
140
-
141
-
142
-
143
-
144
-
145
-
146
-
147
-
148
-
149
-
150
-
151
-
152
-
153
-
154
-
155
-
156
-
157
-
158
-
159
-
160
-
161
-
162
-
163
-
164
-
165
-
166
-
167
-
168
-
169
-
170
-
171
-
172
-
173
-
174
-
175
-
176
-
177
-
178
-
179
-
180
-
181
-
182
-
183
-
184
-
185
-
186
-
187
-
188
-
189
-
190
-
191
-
192
-
193
-
194
-
195
-
196
-
197
-
198
-
199
-
200
-
201
-
202
-
203
-
204
-
205
-
206
-
207
-
208
 |
 |

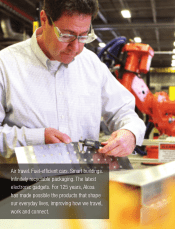
Q A global leader in lightweight metals
engineering and manufacturing, Alcoa
innovates multi-material solutions that
advance our world.
Q Our technologies enhance transportation,
from automotive and commercial transport
to air and space travel, and improve
industrial and consumer electronics
products.
Q We enable smart buildings, sustainable food
and beverage packaging, high-performance
defense vehicles across air, land and sea,
deeper oil and gas drilling and more efficient
power generation.
Q We pioneered the aluminum industry over
125 years ago, and today, our 60,000
people in 30 countries deliver value-add
products made of titanium, nickel and
aluminum, and produce best-in-class
bauxite, alumina and primary aluminum
products.
Q For more information, visit www.alcoa.com,
follow @Alcoa on Twitter at
www.twitter.com/Alcoa and follow us on
Facebook at www.facebook.com/Alcoa.
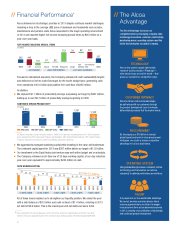
// Alcoa at a Glance// Financial and Operating Highlights
// 2013 Sales: $23.0 Billion
BY SEGMENT BY GEOGRAPHIC AREA
Global Rolled Products
Primary Metals
Engineered Products and Solutions
Alumina
Other
United States
Europe
Pacific
Other Americas
2013 2012 2011
Sales $23,032 $23,700 $24,951
(Loss) Income from continuing operations (2,285) 191 614
Per common share data:
Basic:
(Loss) Income from continuing operations (2.14) 0.18 0.58
Net (loss) income (2.14) 0.18 0.57
Diluted:
(Loss) Income from continuing operations (2.14) 0.18 0.55
Net (loss) income (2.14) 0.18 0.55
Dividends paid 0.12 0.12 0.12
Total assets 35,742 40,179 40,120
Capital expenditures 1,193 1,261 1,287
Cash provided from operations 1,578 1,497 2,193
Book value per share* 9.84 12.32 12.96
Common stock outstanding—end of year (000)** 1,071,011 1,067,212 1,064,412
* Book value per share = (Total shareholders’ equity minus Preferred stock) divided by Common stock
outstanding, end of year.
** There were an estimated 545,000 shareholders, which includes registered shareholders and beneficial
owners holding stock through banks, brokers, or other nominees, as of February 20, 2014 (the record
date for the 2014 annual shareholders’ meeting).
// Number of
Employees
2013 2012 2011
U.S. 26,000 26,000 26,000
Europe 17,000 17,000 17,000
Other Americas 10,000 11,000 11,000
Pacific 7,000 7,000 7,000
60,000 61,000 61,000
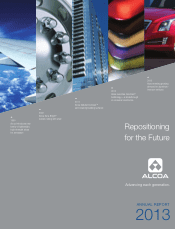
On the Cover // FAR RIGHT: Cadillac ATS © General Motors.
($ in millions, except per-share amounts)
$6.6
$5.7
$3.3 $7.1
6%
51%
26%
17%
$0.3