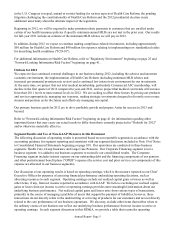
Aetna 2011 Annual Report Download - page 13
Download and view the complete annual report
Please find page 13 of the 2011 Aetna annual report below. You can navigate through the pages in the report by either clicking on the pages listed below, or by using the keyword search tool below to find specific information within the annual report.
Annual Report- Page 7
The table presented below reconciles net income to operating earnings (1):
(Millions)
Net income
Net realized capital gains
Voluntary early retirement program
Transaction-related costs
Litigation-related insurance proceeds
Severance and facilities charge
ESI Settlement
Operating earnings
2011
$ 1,945.8
(79.2)
89.1
—
—
—
—
$ 1,955.7
2010
$ 1,808.7
(131.0)
—
43.1
(101.5)
30.8
—
$ 1,650.1
2009
$ 1,415.3
(19.0)
—
—
(24.9)
60.9
(19.6)
$ 1,412.7
(1) In addition to net realized capital gains, the following items are excluded from operating earnings because we believe they neither relate
to the ordinary course of our business nor reflect our underlying business performance:
• In 2011, we announced a voluntary early retirement program. In connection with the voluntary early retirement program, we
recorded a one-time charge of $89.1 million ($137.0 million pretax) during the third quarter of 2011.
• In 2010, we recorded transaction-related costs of $43.1 million ($66.2 million pretax). These costs related to our Pharmacy
Benefit Management Subcontract Agreement with CVS Caremark Corporation and the announced acquisition of Medicity.
• Following a Pennsylvania Supreme Court ruling in June 2009, we recorded litigation-related proceeds of $101.5 million ($156.3
million pretax) for 2010 and $24.9 million ($38.2 million pretax) for 2009 from our liability insurers related to certain litigation
we settled in 2003.
• In 2010 and 2009 we recorded severance and facilities charges of $30.8 million ($47.4 million pretax) and $60.9 million ($93.7
million pretax), respectively. The severance and facilities charges in each year related to actions taken that year or committed to
be taken in the following year.
• In 2009, we reached an agreement with Express Scripts, Inc. and one of its subsidiaries (collectively "ESI") to settle certain
litigation in which we were the plaintiff. Under the applicable settlement, we received approximately $19.6 million ($30.2
million pretax), net of fees and expenses, in 2009.
Operating earnings in 2011 improved over 2010.
2011 operating earnings were higher than 2010, primarily due to higher Commercial underwriting margins as a
result of low medical utilization, disciplined execution of our pricing and medical cost management strategies and
unit cost controls. 2010 operating earnings were higher than 2009, primarily due to higher Commercial
underwriting margins driven by management actions to appropriately price the business and members' lower
medical utilization, partially offset by the effect of lower Commercial Insured membership in 2010. Our operating
earnings in 2011 and 2010 included $132 million and $76 million, respectively, of after-tax favorable development
of prior-years health care cost estimates. Refer to our discussion of Commercial results below for additional
information.
We calculate our medical benefit ratio (“MBR”) by dividing health care costs by premiums. Our MBRs by product
for the last three years were:
Commercial
Medicare
Medicaid
Total
2011
77.9%
84.0%
87.3%
79.6%
2010
80.6%
87.3%
87.5%
82.3%
2009
84.5%
87.1%
88.6%
85.2%
Refer to our discussion of Commercial and Medicare results below for an explanation of the changes in our MBRs.
Commercial operating results reflect higher underwriting margins and lower Insured membership in 2011
compared to 2010.
Commercial premiums were $368 million lower in 2011 than 2010, primarily due to lower Commercial Insured
membership, partially offset by premium rate increases as well as changes in the customer market, product and
geographic mix of business. Commercial premiums were $949 million lower in 2010 than 2009, primarily due to
lower Commercial Insured membership and the mix of business, partially offset by premium rate increases.


