ADP 2011 Annual Report Download - page 17
Download and view the complete annual report
Please find page 17 of the 2011 ADP annual report below. You can navigate through the pages in the report by either clicking on the pages listed below, or by using the keyword search tool below to find specific information within the annual report.-
 1
1 -
2
-
3
-
4
-
5
-
6
-
 7
7 -
 8
8 -
 9
9 -
 10
10 -
 11
11 -
 12
12 -
 13
13 -
 14
14 -
 15
15 -
 16
16 -
 17
17 -
 18
18 -
 19
19 -
 20
20 -
 21
21 -
 22
22 -
 23
23 -
 24
24 -
 25
25 -
 26
26 -
 27
27 -
28
-
29
-
30
-
31
-
32
-
33
-
34
-
35
-
36
-
37
-
38
-
39
-
40
-
41
-
42
-
43
-
44
-
45
-
46
-
47
-
48
-
49
-
50
-
51
-
52
-
53
-
54
-
55
-
56
-
57
-
58
-
59
-
60
-
61
-
62
-
63
-
64
-
65
-
66
-
67
-
68
-
69
-
70
-
71
-
72
-
73
-
74
-
75
-
76
-
77
-
78
-
79
-
80
-
81
-
82
-
83
-
84
-
85
-
86
-
87
-
88
-
89
-
90
-
91
 |
 |

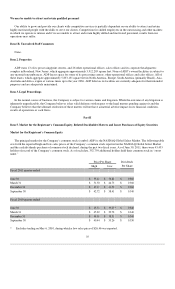
RESULTS OF OPERATIONS
ANALYSIS OF CONSOLIDATED OPERATIONS
Fiscal 2011 Compared to Fiscal 2010
Total Revenues
Our consolidated revenues increased 11% to $9,879.5 million in fiscal 2011, from $8,927.7 million in fiscal 2010, due to an increase in
revenues in Employer Services of 8%, or $485.0 million, to $6,861.7 million, PEO Services of 17%, or $227.1 million, to $1,543.9 million,
and Dealer Services of 24%, or $288.5 million, to $1,494.4 million. In addition, revenues increased $19.6 million due to changes in
foreign currency exchange rates. Total revenue would have increased approximately 6.3% without the impact of acquisitions.
Total Expenses
Our total expenses in fiscal 2011 increased $897.7 million, to $8,063.4 million, from $7,165.7 million in fiscal 2010. The increase in our
consolidated expenses was due to an increase in operating expenses of $623.7 million, an increase in selling, general and
administrative expenses of $195.9 million and an increase in systems development and programming expenses of $63.3 million.
Our total costs of revenues increased 14%, to $5,731.5 million in fiscal 2011, as compared to fiscal 2010 due to an increase in
operating expenses of $623.7 million and an increase in systems development and programming expenses of $63.3 million.
17
(Dollars in millions, except per share amounts)
Years ended June 30,
2011
2010
$ Change
% Change
Total revenues
$
9,879.5
$
8,927.7
$
951.8
11
%
Costs of revenues:
Operating expenses
4,900.9
4,277.2
623.7
15
%
Systems development and
programming costs
577.2
513.9
63.3
12
%
Depreciation and amortization
253.4
238.6
14.8
6
%
Total costs of revenues
5,731.5
5,029.7
701.8
14
%
Selling, general and
administrative expenses
2,323.3
2,127.4
195.9
9
%
Interest expense
8.6
8.6
-
-
Total expenses
8,063.4
7,165.7
897.7
13
%
Other income, net
(116.6
)
(101.2
)
15.4
15
%
Earnings from continuing
operations before income taxes
$
1,932.7
$
1,863.2
$
69.5
4
%
Margin
19.6
%
20.9
%
Provision for income taxes
$
678.5
$
655.9
$
22.6
3
%
Effective tax rate
35.1
%
35.2
%
Net earnings from
continuing operations
$
1,254.2
$
1,207.3
$
46.9
4
%
Diluted earnings per share
from continuing operations
$
2.52
$
2.40
$
0.12
5
%