iHeartMedia 2001 Annual Report Download - page 10
Download and view the complete annual report
Please find page 10 of the 2001 iHeartMedia annual report below. You can navigate through the pages in the report by either clicking on the pages listed below, or by using the keyword search tool below to find specific information within the annual report.-
 1
1 -
 2
2 -
 3
3 -
 4
4 -
 5
5 -
 6
6 -
 7
7 -
 8
8 -
 9
9 -
 10
10 -
 11
11 -
 12
12 -
 13
13 -
 14
14 -
 15
15 -
 16
16 -
 17
17 -
 18
18 -
 19
19 -
 20
20 -
 21
21 -
22
-
23
-
24
-
25
-
26
-
27
-
28
-
29
-
30
-
31
-
32
-
33
-
34
-
35
-
36
-
37
-
38
-
39
-
40
-
41
-
42
-
43
-
44
-
45
-
46
-
47
-
48
-
49
-
50
-
51
-
52
-
53
-
54
-
55
-
56
-
57
-
58
-
59
-
60
-
61
-
62
-
63
-
64
-
65
-
66
-
67
-
68
-
69
-
70
-
71
-
72
-
73
-
74
-
75
-
76
-
77
-
78
-
79
-
80
-
81
-
82
-
83
-
84
-
85
-
86
-
87
-
88
-
89
-
90
-
91
-
92
-
93
-
94
-
95
-
96
-
97
-
98
-
99
-
100
-
101
-
102
-
103
-
104
-
105
-
106
-
107
-
108
-
109
-
110
-
111
 |
 |

10
Operating Segments
Clear Channel consists of three reportable operating segments: radio broadcasting, outdoor
advertising, and live entertainment. The radio broadcasting segment includes radio stations for which we
are the licensee and for which we program and/or sell air time under local marketing agreements or joint
sales agreements. The radio broadcasting segment also operates radio networks. The outdoor advertising
segment includes advertising display faces for which we own or operate under lease management
agreements. The live entertainment segment includes venues that we own or operate, the production of
Broadway shows and theater operations.
Information relating to the operating segments of our radio broadcasting, outdoor advertising and
live entertainment operations for 2001, 2000 and 1999 are included in “Note K: Segment Data” in the
Notes to Consolidated Financial Statements in Item 8 filed herewith.
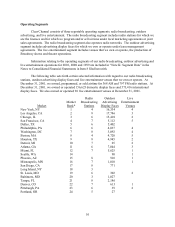
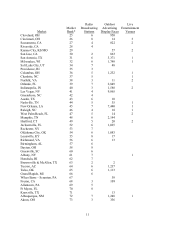
The following table sets forth certain selected information with regard to our radio broadcasting
stations, outdoor advertising display faces and live entertainment venues that we own or operate. At
December 31, 2001, we owned, programmed, or sold airtime for 368 AM and 797 FM radio stations. At
December 31, 2001, we owned or operated 156,623 domestic display faces and 573,416 international
display faces. We also owned or operated 96 live entertainment venues at December 31, 2001.
Market
Market
Rank*
Radio
Broadcasting
Stations
Outdoor
Advertising
Display Faces
Live
Entertainment
Venues
New York, NY 1 4 16,334 4
Los Angeles, CA 2 8 17,786 3
Chicago, IL 3 6 15,410 2
San Francisco, CA 4 7 5,112 5
Dallas, TX 5 6 5,402
Philadelphia, PA 6 6 4,037 4
Washington, DC 7 8 3,092 4
Boston, MA 8 4 4,720 5
Houston, TX 9 8 4,945 2
Detroit, MI 10 7 25 2
Atlanta, GA 11 6 7,044 3
Miami, FL 12 7 5,625 1
Seattle, WA 14 90 1
Phoenix, AZ 15 8 910 1
Minneapolis, MN 16 7 1,010 1
San Diego, CA 17 8 771
Long Island, NY 18 3
St. Louis, MO 19 6 302 2
Baltimore, MD 20 3 1,027
Tampa, FL 21 8 2,186
Denver, CO 22 7 613 1
Pittsburgh, PA 23 6 39 2
Portland, OR 24 5 27