Yamaha 1999 Annual Report Download - page 12
Download and view the complete annual report
Please find page 12 of the 1999 Yamaha annual report below. You can navigate through the pages in the report by either clicking on the pages listed below, or by using the keyword search tool below to find specific information within the annual report.-
 1
1 -
 2
2 -
 3
3 -
 4
4 -
 5
5 -
 6
6 -
 7
7 -
 8
8 -
 9
9 -
 10
10 -
 11
11 -
 12
12 -
 13
13 -
 14
14 -
 15
15 -
 16
16 -
 17
17 -
 18
18 -
 19
19
 |
 |

YAMAHA CONSOLIDATED FINANCIAL REPORT 10
Millions of yen
Musical Furniture Electronic
instruments and equipment
Eliminations
and audio household and metal or unallocated
Year ended March 31, 1998 products products products
Recreation Others Total amounts Consolidated
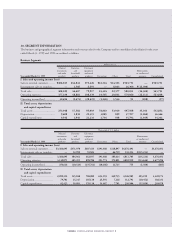
I. Sales and operating income (loss)
Sales to external customers.......... ¥383,365 ¥59,067 ¥128,298 ¥23,727 ¥14,530 ¥608,990 — ¥608,990
Intersegment sales or transfers..... — 1,613 14,189 — 8,546 24,349 ¥(24,349) —
Total sales................................... 383,365 60,681 142,488 23,727 23,077 633,340 (24,349) 608,990
Operating expenses..................... 363,546 60,314 137,062 25,483 22,374 608,780 (23,893) 584,886
Operating income(loss) .............. 19,819 367 5,425 (1,755) 702 24,559 (455) 24,103
II. Total assets, depreciation
and capital expenditures
Total assets ................................. 243,496 22,993 111,635 80,354 57,234 515,716 28,749 544,465
Depreciation............................... 7,696 1,914 23,036 3,075 729 36,454 (1,054) 35,399
Capital expenditures................... 9,312 2,793 22,442 1,963 1,983 38,495 (1,428) 37,066
Notes: (1) Basis of segmentation
Business segments are divided into categories based on the application or nature each product in the market.
The demand for the telecommunication equipments (renamed from CD-Rs as in previous years) which consist primarily of CD-RW
products, has increased. This rise in demand may be attributable to the recent sharp decline in the prices. In addition, these products are
frequently used in conjunction with the audio products in our musical instruments and audio products segment. Effective the current fiscal
year, products have been transferred to the musical instruments and audio products segment.
Under the current classification, sales to external customers and total assets in 1998 would have decreased by ¥12,468 million ($103,426
thousand) and ¥10,450 million ($86,686 thousand), respectively, in the electrical equipment and metal products segment, and would have
increased by the same amounts in the musical instruments and audio products segment, respectively. The effect of this change on operating
income, depre ciation and capital expenditure was immaterial.
(2) Major products in each business segment:
Business segment Major products
Musical instruments Pianos, digital musical instruments, wind instruments, guitars, percussion instruments, educational musical
and audio products instruments, pro-audios, audio products, music schools,telecommunication equipments
Furniture and System kitchens, bathtubs, washstands, furniture, parts for housing facilities, sound equipment for residential use
household products
Electronic equipment LSIs, thin-film head, electronic alloys
and metal products
Recreation Management of leisure facilities
Others Golf and archery equipment, car interior parts, industrial robots.
(3) In connection with a revision to the “Regulations Concerning the Terminology, Forms and Preparation of Consolidated Financial Statements,”
enterprise tax and the related consolidated adjustment have been reclassified. The effect of this change on operating income (loss) was immaterial.
(4) Eliminations or unallocated amounts of total assets principally consist of translation adjustments, which amounted to ¥36,739 million
($304,762 thousand) and ¥29,737 million for the years ended March 31, 1999 and 1998, respectively.