Yamaha 1998 Annual Report Download - page 10
Download and view the complete annual report
Please find page 10 of the 1998 Yamaha annual report below. You can navigate through the pages in the report by either clicking on the pages listed below, or by using the keyword search tool below to find specific information within the annual report.-
 1
1 -
 2
2 -
 3
3 -
 4
4 -
 5
5 -
 6
6 -
 7
7 -
 8
8 -
 9
9 -
 10
10 -
 11
11 -
 12
12 -
 13
13 -
 14
14 -
 15
15 -
 16
16 -
 17
17
 |
 |

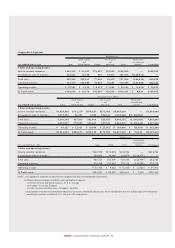
YAMAHA CONSOLIDATED FINANCIAL REPORT 9
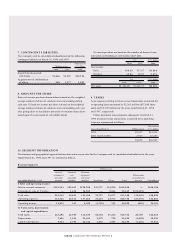
Thousands of U.S. dollars
Musical Furniture Electronic
instruments and equipment
Eliminations
and audio household and metal or unallocated
Year ended March 31, 1998 products products products
Recreation Others Total amounts Consolidated
I. Sales and operating income
Sales to external customers......
$2,902,082 $447,139 $ 971,219 $179,614 $109,992 $4,610,068 — $4,610,068
Intersegment sales or transfers.
— 12,210 107,411 — 64,693 184,322 $(184,322) —
Total sales...............................
2,902,082 459,357 1,078,637 179,614 174,693 4,794,398 (184,322) 4,610,068
Operating expenses.................
2,752,051 456,578 1,037,562 192,907 169,372 4,608,478 (180,871) 4,427,600
Operating income...................
150,030 2,778 41,067 (13,285) 5,314 185,912 (3,444) 182,460
II. Total assets, depreciation
and capital expenditures
Total assets .............................
1,843,270 174,058 845,079 608,282 433,263 3,903,982 217,631 4,121,612
Depreciation...........................
58,259 14,489 174,383 23,278 5,519 275,958 (7,979) 267,971
Capital expenditures...............
70,492 21,143 169,886 14,860 15,011 291,408 (10,810) 280,590
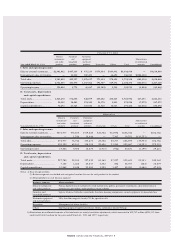
Millions of yen
Musical Furniture Electronic
instruments and equipment
Eliminations
and audio household and metal or unallocated
Year ended March 31, 1997 products products products
Recreation Others Total amounts Consolidated
I. Sales and operating income
Sales to external customers.......... ¥374,977 ¥73,200 ¥119,828 ¥23,786 ¥12,954 ¥604,746 — ¥604,746
Intersegment sales or transfers..... — 1,544 10,644 — 7,362 19,551 ¥(19,551) —
Total sales................................... 374,977 74,744 130,473 23,786 20,317 624,298 (19,551) 604,746
Operating expenses..................... 359,150 69,161 118,194 25,696 21,263 593,467 (18,351) 575,115
Operating income....................... 15,826 5,583 12,278 (1,910) (946) 30,831 (1,199) 29,631
II. Total assets, depreciation
and capital expenditures
Total assets................................. 227,783 29,313 127,432 83,165 57,927 525,621 23,541 549,162
Depreciation............................... 7,132 1,368 20,317 3,302 586 32,707 (432) 32,275
Capital expenditures................... 10,862 2,448 32,385 1,955 1,437 49,090 (1,686) 47,403
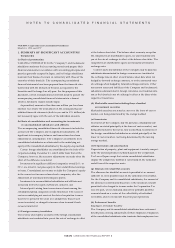
Notes: a) Basis of segmentation
(1) Business segments are divided into categories based on the uses for each product in the market.
(2) Major products in each business segment:
Business segment Major products
Musical instruments Pianos, digital musical instruments, wind instruments, guitars, percussion instruments, educational musical
and audio products instruments, pro-audios, audio products, music schools
Furniture and System kitchens, bathtubs, washstands, furniture, housing components, sound equipment for household use
household products
Electronic equipment LSIs, thin film magnetic heads, CD-Rs, special metals
and metal products
Recreation Management of leisure facilities
Others Sporting equipment (golf and archery), robots, automotive interior fittings
b) Eliminations or unallocated amounts of the total assets are mainly translation adjustments, which amounted to ¥29,737 million ($225,110 thou-
sand) and ¥24,269 million for the years ended March 31, 1998 and 1997, respectively.