XM Radio 2015 Annual Report Download - page 94
Download and view the complete annual report
Please find page 94 of the 2015 XM Radio annual report below. You can navigate through the pages in the report by either clicking on the pages listed below, or by using the keyword search tool below to find specific information within the annual report.-
 1
1 -
2
-
3
-
4
-
5
-
6
-
7
-
8
-
9
-
10
-
11
-
12
-
13
-
14
-
15
-
16
-
17
-
18
-
19
-
20
-
21
-
22
-
23
-
24
-
25
-
26
-
27
-
28
-
29
-
30
-
31
-
32
-
33
-
34
-
35
-
36
-
37
-
38
-
39
-
40
-
41
-
42
-
43
-
44
-
45
-
46
-
47
-
48
-
49
-
50
-
51
-
52
-
53
-
54
-
55
-
56
-
57
-
58
-
59
-
60
-
61
-
62
-
63
-
64
-
65
-
66
-
67
-
68
-
69
-
70
-
71
-
72
-
73
-
74
-
75
-
76
-
77
-
78
-
79
-
80
-
81
-
82
-
83
-
 84
84 -
 85
85 -
 86
86 -
 87
87 -
 88
88 -
 89
89 -
 90
90 -
 91
91 -
 92
92 -
 93
93 -
 94
94 -
 95
95 -
 96
96 -
 97
97 -
 98
98 -
 99
99 -
 100
100 -
 101
101 -
 102
102 -
 103
103 -
 104
104 -
105
-
106
-
107
-
108
-
109
-
110
-
111
-
112
-
113
-
114
-
115
-
116
-
117
-
118
-
119
-
120
-
121
-
122
-
123
-
124
-
125
-
126
-
127
-
128
-
129
-
130
-
131
-
132
 |
 |

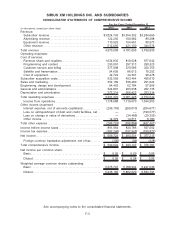
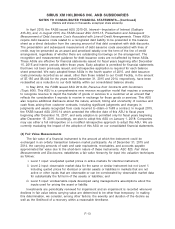
SIRIUS XM HOLDINGS INC. AND SUBSIDIARIES
CONSOLIDATED STATEMENTS OF COMPREHENSIVE INCOME
(in thousands, except per share data) 2015 2014 2013
For the Years Ended December 31,
Revenue:
Subscriber revenue. . . . . . . . . . . . . . . . . . . . . . . . . . . . . . . . . . . . . $3,824,793 $3,554,302 $3,284,660
Advertising revenue . . . . . . . . . . . . . . . . . . . . . . . . . . . . . . . . . . . . 122,292 100,982 89,288
Equipment revenue. . . . . . . . . . . . . . . . . . . . . . . . . . . . . . . . . . . . . 110,923 104,661 80,573
Other revenue. . . . . . . . . . . . . . . . . . . . . . . . . . . . . . . . . . . . . . . . . . 512,050 421,150 344,574
Total revenue . . . . . . . . . . . . . . . . . . . . . . . . . . . . . . . . . . . . . . . . . . . . 4,570,058 4,181,095 3,799,095
Operating expenses:
Cost of services:
Revenue share and royalties. . . . . . . . . . . . . . . . . . . . . . . . . . . . 1,034,832 810,028 677,642
Programming and content . . . . . . . . . . . . . . . . . . . . . . . . . . . . . . 293,091 297,313 290,323
Customer service and billing . . . . . . . . . . . . . . . . . . . . . . . . . . . . 377,908 370,585 320,755
Satellite and transmission. . . . . . . . . . . . . . . . . . . . . . . . . . . . . . . 94,609 86,013 79,292
Cost of equipment. . . . . . . . . . . . . . . . . . . . . . . . . . . . . . . . . . . . . . 42,724 44,397 26,478
Subscriber acquisition costs. . . . . . . . . . . . . . . . . . . . . . . . . . . . . . . 532,599 493,464 495,610
Sales and marketing. . . . . . . . . . . . . . . . . . . . . . . . . . . . . . . . . . . . . . 354,189 336,480 291,024
Engineering, design and development . . . . . . . . . . . . . . . . . . . . . 64,403 62,784 57,969
General and administrative. . . . . . . . . . . . . . . . . . . . . . . . . . . . . . . . 324,801 293,938 262,135
Depreciation and amortization . . . . . . . . . . . . . . . . . . . . . . . . . . . . . 272,214 266,423 253,314
Total operating expenses . . . . . . . . . . . . . . . . . . . . . . . . . . . . . . . . . 3,391,370 3,061,425 2,754,542
Income from operations. . . . . . . . . . . . . . . . . . . . . . . . . . . . . . . . . 1,178,688 1,119,670 1,044,553
Other income (expense):
Interest expense, net of amounts capitalized. . . . . . . . . . . . . (299,103) (269,010) (204,671)
Loss on extinguishment of debt and credit facilities, net . . — — (190,577)
Loss on change in value of derivatives . . . . . . . . . . . . . . . . . . — (34,485) (20,393)
Other income . . . . . . . . . . . . . . . . . . . . . . . . . . . . . . . . . . . . . . . . . . 12,379 14,611 8,180
Total other expense . . . . . . . . . . . . . . . . . . . . . . . . . . . . . . . . . . . . . . (286,724) (288,884) (407,461)
Income before income taxes . . . . . . . . . . . . . . . . . . . . . . . . . . . . . . 891,964 830,786 637,092
Income tax expense . . . . . . . . . . . . . . . . . . . . . . . . . . . . . . . . . . . . . . (382,240) (337,545) (259,877)
Net income. . . . . . . . . . . . . . . . . . . . . . . . . . . . . . . . . . . . . . . . . . . . . . . $ 509,724 $ 493,241 $ 377,215
Foreign currency translation adjustment, net of tax . . . . . . . (100) (94) (428)
Total comprehensive income . . . . . . . . . . . . . . . . . . . . . . . . . . . . . . $ 509,624 $ 493,147 $ 376,787
Net income per common share:
Basic . . . . . . . . . . . . . . . . . . . . . . . . . . . . . . . . . . . . . . . . . . . . . . . . . . $ 0.09 $ 0.09 $ 0.06
Diluted . . . . . . . . . . . . . . . . . . . . . . . . . . . . . . . . . . . . . . . . . . . . . . . . . $ 0.09 $ 0.08 $ 0.06
Weighted average common shares outstanding:
Basic . . . . . . . . . . . . . . . . . . . . . . . . . . . . . . . . . . . . . . . . . . . . . . . . . . 5,375,707 5,788,944 6,227,646
Diluted . . . . . . . . . . . . . . . . . . . . . . . . . . . . . . . . . . . . . . . . . . . . . . . . . 5,435,166 5,862,020 6,384,791
See accompanying notes to the consolidated financial statements.
F-3