Windstream 2013 Annual Report Download - page 155
Download and view the complete annual report
Please find page 155 of the 2013 Windstream annual report below. You can navigate through the pages in the report by either clicking on the pages listed below, or by using the keyword search tool below to find specific information within the annual report.-
 1
1 -
2
-
3
-
4
-
5
-
6
-
7
-
8
-
9
-
10
-
11
-
12
-
13
-
14
-
15
-
16
-
17
-
18
-
19
-
20
-
21
-
22
-
23
-
24
-
25
-
26
-
27
-
28
-
29
-
30
-
31
-
32
-
33
-
34
-
35
-
36
-
37
-
38
-
39
-
40
-
41
-
42
-
43
-
44
-
45
-
46
-
47
-
48
-
49
-
50
-
51
-
52
-
53
-
54
-
55
-
56
-
57
-
58
-
59
-
60
-
61
-
62
-
63
-
64
-
65
-
66
-
67
-
68
-
69
-
70
-
71
-
72
-
73
-
74
-
75
-
76
-
77
-
78
-
79
-
80
-
81
-
82
-
83
-
84
-
85
-
86
-
87
-
88
-
89
-
90
-
91
-
92
-
93
-
94
-
95
-
96
-
97
-
98
-
99
-
100
-
101
-
102
-
103
-
104
-
105
-
106
-
107
-
108
-
109
-
110
-
111
-
112
-
113
-
114
-
115
-
116
-
117
-
118
-
119
-
120
-
121
-
122
-
123
-
124
-
125
-
126
-
127
-
128
-
129
-
130
-
131
-
132
-
133
-
134
-
135
-
136
-
137
-
138
-
139
-
140
-
141
-
142
-
143
-
144
-
 145
145 -
 146
146 -
 147
147 -
 148
148 -
 149
149 -
 150
150 -
 151
151 -
 152
152 -
 153
153 -
 154
154 -
 155
155 -
 156
156 -
 157
157 -
 158
158 -
 159
159 -
 160
160 -
 161
161 -
 162
162 -
 163
163 -
 164
164 -
 165
165 -
166
-
167
-
168
-
169
-
170
-
171
-
172
-
173
-
174
-
175
-
176
-
177
-
178
-
179
-
180
-
181
-
182
-
183
-
184
-
185
-
186
-
187
-
188
-
189
-
190
-
191
-
192
-
193
-
194
-
195
-
196
-
197
-
198
-
199
-
200
-
201
-
202
-
203
-
204
-
205
-
206
-
207
-
208
-
209
-
210
-
211
-
212
-
213
-
214
-
215
-
216
-
217
-
218
-
219
-
220
-
221
-
222
-
223
-
224
-
225
-
226
-
227
-
228
-
229
-
230
-
231
-
232
-
233
-
234
-
235
-
236
 |
 |

F-19
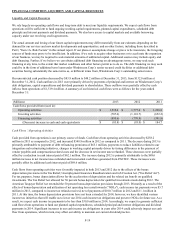
FINANCIAL CONDITION, LIQUIDITY AND CAPITAL RESOURCES
Liquidity and Capital Resources
We rely largely on operating cash flows and long-term debt to meet our liquidity requirements. We expect cash flows from
operations will be sufficient to fund ongoing working capital requirements, planned capital expenditures, scheduled debt
principle and interest payments and dividend payments. We also have access to capital markets and available borrowing
capacity under our revolving credit agreements.
The actual amount and timing of our future capital requirements may differ materially from our estimates depending on the
demand for our services and new market developments and opportunities, and on other factors, including those described in
Part I, "Item 1A. Risk Factors" in this annual report. If our plans or assumptions change or prove to be inaccurate, the foregoing
sources of funds may prove to be insufficient. In addition, if we seek to acquire other businesses or to accelerate the expansion
of our business, we may be required to seek material amounts of additional capital. Additional sources may include equity and
debt financing. Further, if we believe we can obtain additional debt financing on advantageous terms, we may seek such
financing at any time, to the extent that market conditions and other factors permit us to do so. The debt financing we may seek
could be in the form of additional term loans under Windstream Corp.'s senior secured credit facilities or additional debt
securities having substantially the same terms as, or different terms from, Windstream Corp.'s outstanding senior notes.
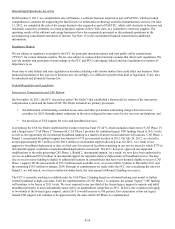
Our unrestricted cash position decreased by $83.8 million to $48.2 million at December 31, 2013, from $132.0 million at
December 31, 2012. Cash outflows in 2013 were primarily driven by payments of principal and interest on Windstream Corp.'s
debt obligations, capital expenditures and dividend payments to shareholders. These outflows were partially offset by cash
inflows from operations of $1,519.4 million. A summary of our historical cash flows were as follows for the years ended
December 31:
(Millions) 2013 2012 2011
Cash flows provided from (used in):
Operating activities $ 1,519.4 $ 1,777.6 $ 1,228.8
Investing activities (707.6)(1,101.7)(652.2)
Financing activities (895.6)(770.9)(391.9)
(Decrease) increase in cash and cash equivalents $ (83.8) $ (95.0) $ 184.7
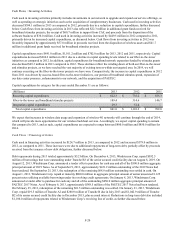
Cash Flows – Operating Activities
Cash provided from operations is our primary source of funds. Cash flows from operating activities decreased by $258.2
million in 2013 as compared to 2012, and increased $548.8 million in 2012 as compared to 2011. The decrease during 2013 is
primarily attributable to payment of debt refinancing premiums of $65.1 million, payments to reduce liabilities related to our
integration and restructuring initiatives, changes in working capital primarily driven by timing differences in the payment of
vendor payables and compensation-related costs and the decrease in net income taxes refunded. These decreases were partially
offset by a reduction in cash interest paid of $62.1 million. The increase during 2012 is primarily attributable to the $89.6
million increase in net income taxes refunded and incremental cash flows generated from PAETEC. These increases were
partially offset by additional cash interest paid of $69.6 million.
Cash flows from operating activities were favorably impacted in both 2013 and 2012 due to the effects of the bonus
depreciation provisions in the Tax Relief, Unemployment Insurance Reauthorization and Job Creation Act ("Tax Relief Act").
For tax purposes, bonus depreciation allows for the acceleration of depreciation and the related tax benefit on qualified
investments. The Tax Relief Act allowed for 50 percent bonus depreciation for qualified investments made during 2012. The
American Taxpayer Relief Act extended the 50 percent bonus depreciation provisions through 2013. Primarily as a result of the
effects of bonus depreciation and utilization of net operating loss carryforwards ("NOLs"), cash income tax payments were $5.7
million in 2013, compared to income tax refunds received, net of payments of $100.7 million in 2012 and $11.1 million in
2011. At this time, the bonus depreciation provisions have not been extended for 2014; however, we have identified various
income tax initiatives that will enable us to lower our 2014 cash income tax obligations and preserve NOLs for future use. As a
result, we expect cash income tax payments to be less than $30.0 million in 2014. Accordingly, we expect to generate sufficient
cash flows from operations to fund our planned capital expenditures, scheduled principal and interest obligations and dividend
payments in 2014. Significant increases in our cash income tax obligations in years after 2014 could adversely impact our cash
flow from operations, which in turn, may affect our ability to maintain our current dividend practice.