Windstream 2011 Annual Report Download - page 117
Download and view the complete annual report
Please find page 117 of the 2011 Windstream annual report below. You can navigate through the pages in the report by either clicking on the pages listed below, or by using the keyword search tool below to find specific information within the annual report.-
 1
1 -
2
-
3
-
4
-
5
-
6
-
7
-
8
-
9
-
10
-
11
-
12
-
13
-
14
-
15
-
16
-
17
-
18
-
19
-
20
-
21
-
22
-
23
-
24
-
25
-
26
-
27
-
28
-
29
-
30
-
31
-
32
-
33
-
34
-
35
-
36
-
37
-
38
-
39
-
40
-
41
-
42
-
43
-
44
-
45
-
46
-
47
-
48
-
49
-
50
-
51
-
52
-
53
-
54
-
55
-
56
-
57
-
58
-
59
-
60
-
61
-
62
-
63
-
64
-
65
-
66
-
67
-
68
-
69
-
70
-
71
-
72
-
73
-
74
-
75
-
76
-
77
-
78
-
79
-
80
-
81
-
82
-
83
-
84
-
85
-
86
-
87
-
88
-
89
-
90
-
91
-
92
-
93
-
94
-
95
-
96
-
97
-
98
-
99
-
100
-
101
-
102
-
103
-
104
-
105
-
106
-
 107
107 -
 108
108 -
 109
109 -
 110
110 -
 111
111 -
 112
112 -
 113
113 -
 114
114 -
 115
115 -
 116
116 -
 117
117 -
 118
118 -
 119
119 -
 120
120 -
 121
121 -
 122
122 -
 123
123 -
 124
124 -
 125
125 -
 126
126 -
 127
127 -
128
-
129
-
130
-
131
-
132
-
133
-
134
-
135
-
136
-
137
-
138
-
139
-
140
-
141
-
142
-
143
-
144
-
145
-
146
-
147
-
148
-
149
-
150
-
151
-
152
-
153
-
154
-
155
-
156
-
157
-
158
-
159
-
160
-
161
-
162
-
163
-
164
-
165
-
166
-
167
-
168
-
169
-
170
-
171
-
172
-
173
-
174
-
175
-
176
-
177
-
178
-
179
-
180
-
181
-
182
-
183
-
184
-
185
-
186
-
187
-
188
-
189
-
190
-
191
-
192
-
193
-
194
-
195
-
196
-
197
-
198
-
199
-
200
 |
 |

F-9
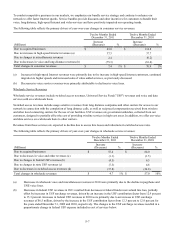
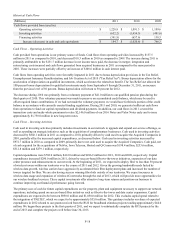
Cost of Services
Cost of services expenses primarily consist of network operations costs, including salaries and wages, employee benefits,
materials, contract services and information technology costs to support the network. Cost of services expenses also include
interconnection expense, which are costs incurred to access the public switched network and transport traffic to the Internet,
bad debt expense and business taxes. Interconnection expenses include charges to lease network components required for
service delivery in markets where we do not own the primary network infrastructure. As a result, we expect interconnection
expenses in these operations to be higher as a percentage of revenues than these same costs incurred in our other markets. The
following table reflects the primary drivers of year-over-year changes in cost of services:
(Millions)
Due to acquired businesses
Due to increases in pension expense (a)
Due to changes in network operations and other (b)
Due to changes in interconnection expense (c)
Due to increases in federal USF expenses (d)
Due to decreases in business taxes (e)
Due to decreases in postretirement expense (f)
Total changes in cost of services
Twelve Months Ended
December 31, 2011
Increase
(Decrease)
$ 266.7
86.5
13.4
5.1
2.1
(2.0)
(14.4)
$ 357.4
%
27%
Twelve Months Ended
December 31, 2010
Increase
(Decrease)
$ 382.8
54.9
(1.7)
(33.9)
5.9
(7.7)
(6.8)
$ 393.5
%
42%
(a) The increase in pension expense in 2011 was primarily due to a decline in the discount rate from 5.31 percent to 4.64
percent, and the increase in pension expense in 2010 was due to a decline in the discount rate from 5.89 percent to
5.31 percent. Lower returns on pension plan assets also contributed to the increase in pension expense in both years.
(b) Increases in network operations and other expenses during 2011 were due to increases in marketing services, which
include charges incurred to provide third party services to customers and charges incurred to provide voice features
and value added data services to customers, partially offset by a decrease in network operations expense. Decreases in
network operations and other expenses in 2010 were primarily attributable to cost saving measures and storm-related
expenses in 2009 that did not recur, partially offset by increases in network support costs and charges incurred to
provide third party services to customers.
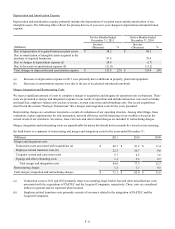
(c) Increases in interconnection expense in 2011 were attributable to increased purchases of higher capacity circuits to
service the growth in data customers, partially offset by the favorable impact of network efficiency projects, the
impact of voice line losses and rate reductions. Decreases in interconnection expenses in 2010 were due to the
favorable impact of network efficiency projects, the impact of voice line losses and rate reductions. Partially offsetting
these decreases were increases associated with purchases of higher capacity circuits to service the growth in data
customers.
(d) Increases in federal USF contributions in 2011 and 2010 were primarily due to an increase in the USF contribution
factors from 12.3 percent to 12.9 percent and 15.3 percent for the years ended December 31, 2009, 2010 and 2011,
respectively. This increase resulted in a proportionate increase in federal USF surcharge revenues in 2011 and 2010.
(e) Decreases in business taxes in 2011 and 2010 were primarily attributable to lower property tax assessments.
(f) Decreases in 2011 postretirement expense were primarily attributable to the amendment of postretirement benefit
plans to eliminate the basic retiree life insurance coverage plan for certain current and future retirees effective January
1, 2012. Decreases in 2010 were driven by plan amendments.