Whirlpool 2008 Annual Report Download - page 100
Download and view the complete annual report
Please find page 100 of the 2008 Whirlpool annual report below. You can navigate through the pages in the report by either clicking on the pages listed below, or by using the keyword search tool below to find specific information within the annual report.-
 1
1 -
2
-
3
-
4
-
5
-
6
-
7
-
8
-
9
-
10
-
11
-
12
-
13
-
14
-
15
-
16
-
17
-
18
-
19
-
20
-
21
-
22
-
23
-
24
-
25
-
26
-
27
-
28
-
29
-
30
-
31
-
32
-
33
-
34
-
35
-
36
-
37
-
38
-
39
-
40
-
41
-
42
-
43
-
44
-
45
-
46
-
47
-
48
-
49
-
50
-
51
-
52
-
53
-
54
-
55
-
56
-
57
-
58
-
59
-
60
-
61
-
62
-
63
-
64
-
65
-
66
-
67
-
68
-
69
-
70
-
71
-
72
-
73
-
74
-
75
-
76
-
77
-
78
-
79
-
80
-
81
-
82
-
83
-
84
-
85
-
86
-
87
-
88
-
89
-
 90
90 -
 91
91 -
 92
92 -
 93
93 -
 94
94 -
 95
95 -
 96
96 -
 97
97 -
 98
98 -
 99
99 -
 100
100 -
 101
101 -
 102
102 -
 103
103 -
 104
104
 |
 |

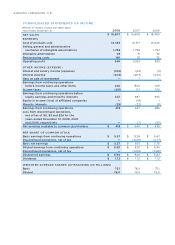
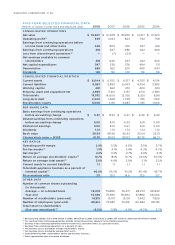
(Millions of dollars, except share and employee data) 2007 2006 2005 2004
$ 19,408 $ 18,080 $ 14,317 $ 13,220
1,063 823 792 758
804 619 597 616
647 486 422 406
(7)(53) — —
640 433 422 406
536 576 494 511
562 520 440 443
134 130 116 116
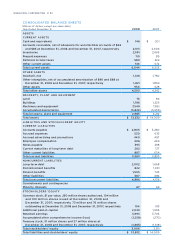
$ 6,555 $ 6,517 $ 4,763 $ 4,514
5,893 6,043 4,354 3,985
662 474 409 529
3,212 3,157 2,511 2,583
14,009 13,759 8,301 8,181
1,668 1,798 745 1,160
3,911 3,283 1,745 1,606
$ 8.24 $ 6.47 $ 6.30 $ 6.02
8.10 6.35 6.19 5.90
8.01 5.67 6.19 5.90
1.72 1.72 1.72 1.72
48.96 42.93 25.54 23.31
81.63 83.02 83.76 69.21
5.5%4.6%5.5% 5.7%
4.1%3.4%4.2% 4.7%
3.3% 2.7% 2.9%3.1%
18.1%15.7%24.6%30.3%
4.6%3.9%5.1%5.2%
1.1 1.1 1.1 1.1
34.5%41.2%40.4%45.7%
10.2 14.6 13.5 11.7
79,880 76,471 68,272 68,902
75,835 78,484 67,880 66,604
15,011 15,311 7,442 7,826
73,682 73,416 65,682 68,125
11.8%4.9%14.5% 3.7%