Western Union 2011 Annual Report Download - page 117
Download and view the complete annual report
Please find page 117 of the 2011 Western Union annual report below. You can navigate through the pages in the report by either clicking on the pages listed below, or by using the keyword search tool below to find specific information within the annual report.-
 1
1 -
2
-
3
-
4
-
5
-
6
-
7
-
8
-
9
-
10
-
11
-
12
-
13
-
14
-
15
-
16
-
17
-
18
-
19
-
20
-
21
-
22
-
23
-
24
-
25
-
26
-
27
-
28
-
29
-
30
-
31
-
32
-
33
-
34
-
35
-
36
-
37
-
38
-
39
-
40
-
41
-
42
-
43
-
44
-
45
-
46
-
47
-
48
-
49
-
50
-
51
-
52
-
53
-
54
-
55
-
56
-
57
-
58
-
59
-
60
-
61
-
62
-
63
-
64
-
65
-
66
-
67
-
68
-
69
-
70
-
71
-
72
-
73
-
74
-
75
-
76
-
77
-
78
-
79
-
80
-
81
-
82
-
83
-
84
-
85
-
86
-
87
-
88
-
89
-
90
-
91
-
92
-
93
-
94
-
95
-
96
-
97
-
98
-
99
-
100
-
101
-
102
-
103
-
104
-
105
-
106
-
 107
107 -
 108
108 -
 109
109 -
 110
110 -
 111
111 -
 112
112 -
 113
113 -
 114
114 -
 115
115 -
 116
116 -
 117
117 -
 118
118 -
 119
119 -
 120
120 -
 121
121 -
 122
122 -
 123
123 -
 124
124 -
 125
125 -
 126
126 -
 127
127 -
128
-
129
-
130
-
131
-
132
-
133
-
134
-
135
-
136
-
137
-
138
-
139
-
140
-
141
-
142
-
143
-
144
-
145
-
146
-
147
-
148
-
149
-
150
-
151
-
152
-
153
-
154
-
155
-
156
-
157
-
158
-
159
-
160
-
161
-
162
-
163
-
164
-
165
-
166
-
167
-
168
-
169
 |
 |

THE WESTERN UNION COMPANY
NOTES TO CONSOLIDATED FINANCIAL STATEMENTS—(Continued)
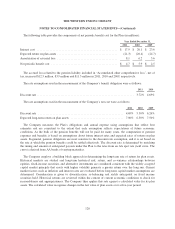
If potential impairment exists, the Company assesses whether it has the intent to sell the debt security, more
likely than not will be required to sell the debt security before its anticipated recovery or expects that some of the
contractual cash flows will not be received. The Company had no material other-than-temporary impairments
during the periods presented.
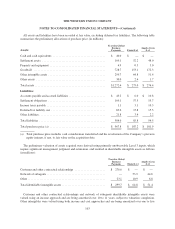
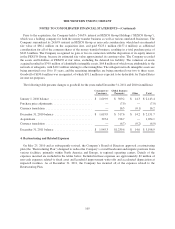
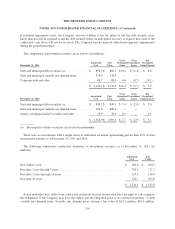
The components of investment securities are as follows (in millions):
December 31, 2011
Amortized
Cost
Fair
Value
Gross
Unrealized
Gains
Gross
Unrealized
Losses
Net
Unrealized
Gains/(Losses)
State and municipal debt securities (a) ...............$ 858.5 $ 866.5 $10.4 $ (2.4) $ 8.0
State and municipal variable rate demand notes ........ 376.9 376.9 — — —
Corporate debt and other .......................... 88.7 88.6 0.6 (0.7) (0.1)
$ 1,324.1 $ 1,332.0 $11.0 $ (3.1) $ 7.9
December 31, 2010
Amortized
Cost
Fair
Value
Gross
Unrealized
Gains
Gross
Unrealized
Losses
Net
Unrealized
Gains/(Losses)
State and municipal debt securities (a) ...............$ 844.1 $ 849.1 $ 7.0 $ (2.0) $ 5.0
State and municipal variable rate demand notes ........ 490.0 490.0 — — —
Agency mortgage-backed securities and other ......... 29.9 30.0 0.1 — 0.1
$ 1,364.0 $ 1,369.1 $ 7.1 $ (2.0) $ 5.1
(a) The majority of these securities are fixed rate instruments.
There were no investments with a single issuer or individual securities representing greater than 10% of total
investment securities as of December 31, 2011 and 2010.
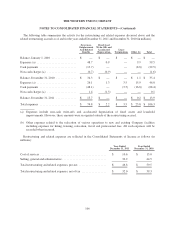
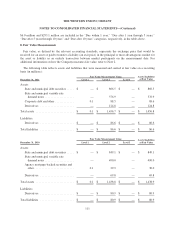
The following summarizes contractual maturities of investment securities as of December 31, 2011 (in
millions):
Amortized
Cost
Fair
Value
Due within 1 year ...................................................... $ 180.0 $ 180.5
Due after 1 year through 5 years ........................................... 705.6 713.3
Due after 5 years through 10 years ......................................... 115.8 114.6
Due after 10 years ...................................................... 322.7 323.6
$ 1,324.1 $ 1,332.0
Actual maturities may differ from contractual maturities because issuers may have the right to call or prepay
the obligations or the Company may have the right to put the obligation prior to its contractual maturity, as with
variable rate demand notes. Variable rate demand notes, having a fair value of $12.4 million, $65.4 million,
110