Wells Fargo 2011 Annual Report Download - page 209
Download and view the complete annual report
Please find page 209 of the 2011 Wells Fargo annual report below. You can navigate through the pages in the report by either clicking on the pages listed below, or by using the keyword search tool below to find specific information within the annual report.-
 1
1 -
2
-
3
-
4
-
5
-
6
-
7
-
8
-
9
-
10
-
11
-
12
-
13
-
14
-
15
-
16
-
17
-
18
-
19
-
20
-
21
-
22
-
23
-
24
-
25
-
26
-
27
-
28
-
29
-
30
-
31
-
32
-
33
-
34
-
35
-
36
-
37
-
38
-
39
-
40
-
41
-
42
-
43
-
44
-
45
-
46
-
47
-
48
-
49
-
50
-
51
-
52
-
53
-
54
-
55
-
56
-
57
-
58
-
59
-
60
-
61
-
62
-
63
-
64
-
65
-
66
-
67
-
68
-
69
-
70
-
71
-
72
-
73
-
74
-
75
-
76
-
77
-
78
-
79
-
80
-
81
-
82
-
83
-
84
-
85
-
86
-
87
-
88
-
89
-
90
-
91
-
92
-
93
-
94
-
95
-
96
-
97
-
98
-
99
-
100
-
101
-
102
-
103
-
104
-
105
-
106
-
107
-
108
-
109
-
110
-
111
-
112
-
113
-
114
-
115
-
116
-
117
-
118
-
119
-
120
-
121
-
122
-
123
-
124
-
125
-
126
-
127
-
128
-
129
-
130
-
131
-
132
-
133
-
134
-
135
-
136
-
137
-
138
-
139
-
140
-
141
-
142
-
143
-
144
-
145
-
146
-
147
-
148
-
149
-
150
-
151
-
152
-
153
-
154
-
155
-
156
-
157
-
158
-
159
-
160
-
161
-
162
-
163
-
164
-
165
-
166
-
167
-
168
-
169
-
170
-
171
-
172
-
173
-
174
-
175
-
176
-
177
-
178
-
179
-
180
-
181
-
182
-
183
-
184
-
185
-
186
-
187
-
188
-
189
-
190
-
191
-
192
-
193
-
194
-
195
-
196
-
197
-
198
-
 199
199 -
 200
200 -
 201
201 -
 202
202 -
 203
203 -
 204
204 -
 205
205 -
 206
206 -
 207
207 -
 208
208 -
 209
209 -
 210
210 -
 211
211 -
 212
212 -
 213
213 -
 214
214 -
 215
215 -
 216
216 -
 217
217 -
 218
218 -
 219
219 -
220
-
221
-
222
-
223
-
224
-
225
-
226
-
227
-
228
-
229
-
230
-
231
-
232
-
233
-
234
-
235
-
236
-
237
-
238
-
239
-
240
 |
 |

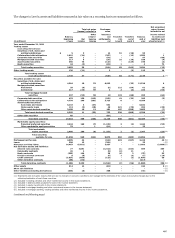
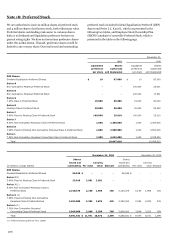
In March 2011, the Company issued Series I preferred stock
(25,010 shares with a par value of $2.5 billion) to an
unconsolidated wholly-owned trust. We have the option to
redeem this Series I Preferred Stock at any time, in whole or in
part, at a redemption price equal to $100,000 per share.
In 2011, we redeemed $9.2 billion of trust preferred
securities of which $5.8 billion settled in October 2011. Prior to
the October 2011 redemption, we had a commitment to issue
Series A preferred stock ($2.5 billion) and Series B preferred
stock ($1.8 billion) to unconsolidated wholly-owned trusts.
Effective with the redemption, the commitment has been
eliminated. See Note 8 for additional information on our trust
preferred securities. We do not have a commitment to issue
Series G or H preferred stock.
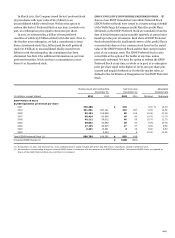
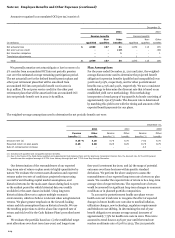
ESOP CUMULATIVE CONVERTIBLE PREFERRED STOCK
All
shares of our ESOP Cumulative Convertible Preferred Stock
(ESOP Preferred Stock) were issued to a trustee acting on behalf
of the Wells Fargo & Company 401(k) Plan (the 401(k) Plan).
Dividends on the ESOP Preferred Stock are cumulative from the
date of initial issuance and are payable quarterly at annual rates
based upon the year of issuance. Each share of ESOP Preferred
Stock released from the unallocated reserve of the 401(k) Plan is
converted into shares of our common stock based on the stated
value of the ESOP Preferred Stock and the then current market
price of our common stock. The ESOP Preferred Stock is also
convertible at the option of the holder at any time, unless
previously redeemed. We have the option to redeem the ESOP
Preferred Stock at any time, in whole or in part, at a redemption
price per share equal to the higher of (a) $1,000 per share plus
accrued and unpaid dividends or (b) the fair market value, as
defined in the Certificates of Designation for the ESOP Preferred
Stock.
Shares issued and outstanding
Carrying value
Adjustable
December 31,
December 31,
dividend rate
(in millions, except shares)
2011
2010
2011
2010
Minimum
Maximum
ESOP Preferred Stock
$1,000 liquidation preference per share
2011
370,280
-
$
370
-
9.00
%
10.00
2010
231,361
287,161
232
287
9.50
10.50
2008
89,154
104,854
89
105
10.50
11.50
2007
68,414
82,994
69
83
10.75
11.75
2006
46,112
58,632
46
59
10.75
11.75
2005
30,092
40,892
30
41
9.75
10.75
2004
17,115
26,815
17
27
8.50
9.50
2003
6,231
13,591
6
13
8.50
9.50
2002
-
3,443
-
3
10.50
11.50
Total ESOP Preferred Stock (1)
858,759
618,382
$
859
618
Unearned ESOP shares (2)
$
(926)
(663)
(1) At December 31, 2011 and December 31, 2010, additional paid-in capital included $67 million and $45 million, respectively, related to preferred stock.
(2) We recorded a corresponding charge to unearned ESOP shares in connection with the issuance of the ESOP Preferred Stock. The unearned ESOP shares are reduced as
shares of the ESOP Preferred Stock are committed to be released.
207