Volvo 2015 Annual Report Download - page 163
Download and view the complete annual report
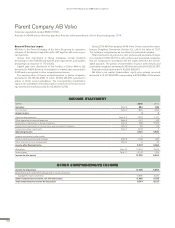
Please find page 163 of the 2015 Volvo annual report below. You can navigate through the pages in the report by either clicking on the pages listed below, or by using the keyword search tool below to find specific information within the annual report.-
 1
1 -
2
-
3
-
4
-
5
-
6
-
7
-
8
-
9
-
10
-
11
-
12
-
13
-
14
-
15
-
16
-
17
-
18
-
19
-
20
-
21
-
22
-
23
-
24
-
25
-
26
-
27
-
28
-
29
-
30
-
31
-
32
-
33
-
34
-
35
-
36
-
37
-
38
-
39
-
40
-
41
-
42
-
43
-
44
-
45
-
46
-
47
-
48
-
49
-
50
-
51
-
52
-
53
-
54
-
55
-
56
-
57
-
58
-
59
-
60
-
61
-
62
-
63
-
64
-
65
-
66
-
67
-
68
-
69
-
70
-
71
-
72
-
73
-
74
-
75
-
76
-
77
-
78
-
79
-
80
-
81
-
82
-
83
-
84
-
85
-
86
-
87
-
88
-
89
-
90
-
91
-
92
-
93
-
94
-
95
-
96
-
97
-
98
-
99
-
100
-
101
-
102
-
103
-
104
-
105
-
106
-
107
-
108
-
109
-
110
-
111
-
112
-
113
-
114
-
115
-
116
-
117
-
118
-
119
-
120
-
121
-
122
-
123
-
124
-
125
-
126
-
127
-
128
-
129
-
130
-
131
-
132
-
133
-
134
-
135
-
136
-
137
-
138
-
139
-
140
-
141
-
142
-
143
-
144
-
145
-
146
-
147
-
148
-
149
-
150
-
151
-
152
-
 153
153 -
 154
154 -
 155
155 -
 156
156 -
 157
157 -
 158
158 -
 159
159 -
 160
160 -
 161
161 -
 162
162 -
 163
163 -
 164
164 -
 165
165 -
 166
166 -
 167
167 -
 168
168 -
 169
169 -
 170
170 -
 171
171 -
 172
172 -
 173
173 -
174
-
175
-
176
-
177
-
178
-
179
-
180
-
181
-
182
-
183
-
184
-
185
-
186
-
187
-
188
-
189
-
190
-
191
-
192
-
193
-
194
-
195
-
196
-
197
-
198
-
199
-
200
-
201
-
202
-
203
-
204
 |
 |

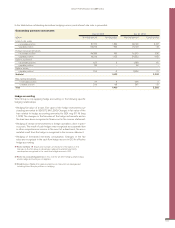
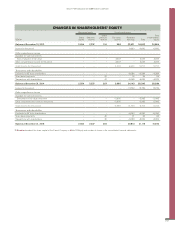
CHANGES IN SHAREHOLDERS’ EQUITY
Restricted equity Unrestricted equity
SEK M Share
capital Statutory
reserve
Share
premium
reserve Fair value
reserve Retained
earnings Total
Total
shareholders’
equity
Balance at December 31, 2013 2,554 7,337 214 958 23,521 24,693 34,584
Income for the period – – – – 6,690 6,690 6,690
Other comprehensive income
Available-for-sale investments:
Gain at valuation to fair value – – – 3,037 – 3,037 3,037
Other comprehensive income for the period – – – 3,037 - 3,037 3,037
Total income for the period – – – 3,037 6,690 9,727 9,727
Transactions with shareholders
Dividends to AB Volvo shareholders – – – – –6,084 –6,084 –6,084
Share based payments – – 43 – 16 59 59
Transactions with shareholders – – 43 – –6,068 –6,025 –6,025
Balance at December 31, 2014 2,554 7,337 257 3,995 24,143 28,395 38,286
Income for the period – – – – 12,739 12,739 12,739
Other comprehensive income
Available-for-sale investments:
Divestment of fair value investment – – – –3,995 – –3,995 –3,995
Other comprehensive income for the period – – – –3,995 - -3,995 -3,995
Total income for the period –– ––3,995 12,739 8,744 8,744
Transactions with shareholders
Dividends to AB Volvo shareholders – – – – –6,090 –6,090 –6,090
Share based payments – – 45 – 21 66 66
Transactions with shareholders – – 45 – –6,069 –6,024 –6,024
Balance at December 31, 2015 2,554 7,337 302 –30,813 31,115 41,006
Read more about the share capital of the Parent Company in Note 19 Equity and number of shares in the consolidated financial statements.
161
GROUP PERFORMANCE 2015 PARENT COMPANY