Volvo 2011 Annual Report Download - page 96
Download and view the complete annual report
Please find page 96 of the 2011 Volvo annual report below. You can navigate through the pages in the report by either clicking on the pages listed below, or by using the keyword search tool below to find specific information within the annual report.-
 1
1 -
2
-
3
-
4
-
5
-
6
-
7
-
8
-
9
-
10
-
11
-
12
-
13
-
14
-
15
-
16
-
17
-
18
-
19
-
20
-
21
-
22
-
23
-
24
-
25
-
26
-
27
-
28
-
29
-
30
-
31
-
32
-
33
-
34
-
35
-
36
-
37
-
38
-
39
-
40
-
41
-
42
-
43
-
44
-
45
-
46
-
47
-
48
-
49
-
50
-
51
-
52
-
53
-
54
-
55
-
56
-
57
-
58
-
59
-
60
-
61
-
62
-
63
-
64
-
65
-
66
-
67
-
68
-
69
-
70
-
71
-
72
-
73
-
74
-
75
-
76
-
77
-
78
-
79
-
80
-
81
-
82
-
83
-
84
-
85
-
 86
86 -
 87
87 -
 88
88 -
 89
89 -
 90
90 -
 91
91 -
 92
92 -
 93
93 -
 94
94 -
 95
95 -
 96
96 -
 97
97 -
 98
98 -
 99
99 -
 100
100 -
 101
101 -
 102
102 -
 103
103 -
 104
104 -
 105
105 -
 106
106 -
107
-
108
-
109
-
110
-
111
-
112
-
113
-
114
-
115
-
116
-
117
-
118
-
119
-
120
-
121
-
122
-
123
-
124
-
125
-
126
-
127
-
128
-
129
-
130
-
131
-
132
-
133
-
134
-
135
-
136
-
137
-
138
-
139
-
140
-
141
-
142
-
143
-
144
-
145
-
146
-
147
-
148
-
149
-
150
-
151
-
152
-
153
-
154
-
155
-
156
-
157
-
158
-
159
-
160
-
161
-
162
-
163
-
164
-
165
-
166
 |
 |

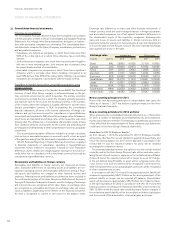
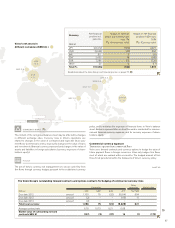
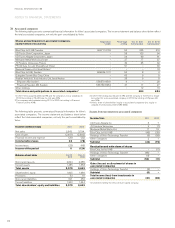
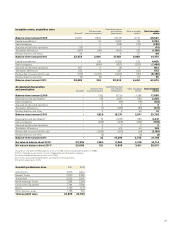
The following table presents summarized financial information for Volvo’s
associated companies. The income statement and balance sheet below
reflect the total associated companies, not only the part consolidated by
Volvo.
Income statement data 2011 2010
Net sales 2,543 3,794
Cost of sales (2,491) (3,840)
Financial income and expense (29) (32)
Income before taxes 23 (78)
Income taxes (23) (46)
Income of the period 0 (124)
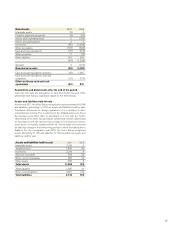
Balance sheet data Dec 31
2011 Dec 31
2010
Non-current assets 2,094 2,085
Current assets 1,485 1,558
Total assets 3,579 3,643
Shareholders' equity 1,605 1,686
Provisions 53 61
Non-currentliabilities 621 452
Current liabilities 1,300 1,444
Total shareholders' equity and liabilities 3,579 3,643
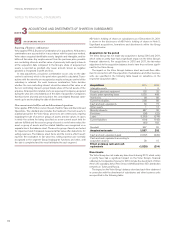
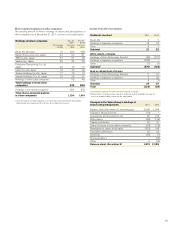
Income from investments in associated companies
Income/loss 2011 2010
UD TrucksNiigata Co 5 7
JV Fonderie Venissieux 4 (1)
Merkavim Metal Works Ltd 17 15
Blue Chip Jet I & II HB (46) (39)
Holdings of Volvo Technology Transfer1(6) (58)
Other companies 2 1
Subtotal (24) (75)
Revaluation and write-down of shares
Blue Chip Jet I & II HB – (11)
Holdings of Volvo Technology Transfer1(48) –
Other companies (4) –
Subtotal (52) (11)
Gains (losses) on divestment of shares in
associated companies
Holdings of Volvo Technology Transfer1(5) –
Subtotal (5) –
Total income (loss) from investments in
associated companies (81) (86)
1 Investments held by the Volvo venture-capital company.
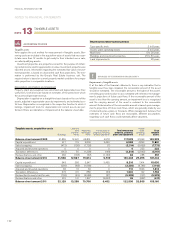
Associated companies
The following table presents summarized financial information for Volvo’s associated companies. The income statement and balance sheet below reflect
the total associated companies, not only the part consolidated by Volvo.
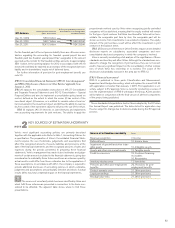
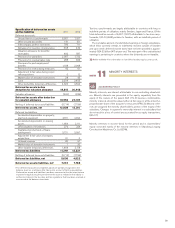
Shares and participations in associated companies,
equity method of accounting Registration
number Percentage
holding Dec 31, 2011
Carrying value Dec 31, 2010
Carrying value
Blue Chip Jet II HB, Sweden 969717-2105 50 405 319
UD Trucks Doto Corporation, Japan – 38 103 94
UD Trucks Niigata Corporation, Japan – 34 69 61
Merkavim Metal Works Ltd, Israel – 27 17 37
JV Fonderie Venissieux, France – 49 35 32
PK-UD Axle Co.,Ltd. (HangZhou), China1– 51 – 30
Diamond Finance Ltd, Great Britain2– – – 18
Blue Chip Jet HB, Sweden 969639-1011 50 8 3
Quingdao Sunwin Bus Corp, China – 43 9 9
Arabian Vehicle & Truck Industry Ltd, Saudi Arabia – 25 9 9
Effpower AB, Sweden3556570-8541 9 – 29
Powercell Sweden AB, Sweden 556759-8353 47 17 27
Other holdings – – 12 16
Total shares and participations in associated companies4 684 684
1 In 2011 Volvo acquired additional 6% and the company is now a subsidiary. In
2010 the holding in PK-UD Axle Co., Ltd was 45%.
2 The company was liquidated during 2011. In 2010 the holding in Diamond
Finance Ltd was 40%.
3 In 2011 the holding was reduced to 9% and the company is therefore no longer
accounted for as an associated company. In 2010 the holding in Effpower AB
was 34%.
4 Volvo’s share of shareholders’ equity in associated companies (incl. equity in
untaxed reserves) amounted to 684 (684).
NOTES TO FINANCIAL STATEMENTS
FINANCIAL INFORMATION 2011
92