Volvo 2010 Annual Report Download - page 9
Download and view the complete annual report
Please find page 9 of the 2010 Volvo annual report below. You can navigate through the pages in the report by either clicking on the pages listed below, or by using the keyword search tool below to find specific information within the annual report.-
 1
1 -
 2
2 -
 3
3 -
 4
4 -
 5
5 -
 6
6 -
 7
7 -
 8
8 -
 9
9 -
 10
10 -
 11
11 -
 12
12 -
 13
13 -
 14
14 -
 15
15 -
 16
16 -
 17
17 -
 18
18 -
 19
19 -
 20
20 -
21
-
22
-
23
-
24
-
25
-
26
-
27
-
28
-
29
-
30
-
31
-
32
-
33
-
34
-
35
-
36
-
37
-
38
-
39
-
40
-
41
-
42
-
43
-
44
-
45
-
46
-
47
-
48
-
49
-
50
-
51
-
52
-
53
-
54
-
55
-
56
-
57
-
58
-
59
-
60
-
61
-
62
-
63
-
64
-
65
-
66
-
67
-
68
-
69
-
70
-
71
-
72
-
73
-
74
-
75
-
76
-
77
-
78
-
79
-
80
-
81
-
82
-
83
-
84
-
85
-
86
-
87
-
88
-
89
-
90
-
91
-
92
-
93
-
94
-
95
-
96
-
97
-
98
-
99
-
100
-
101
-
102
-
103
-
104
-
105
-
106
-
107
-
108
-
109
-
110
-
111
-
112
-
113
-
114
-
115
-
116
-
117
-
118
-
119
-
120
-
121
-
122
-
123
-
124
-
125
-
126
-
127
-
128
-
129
-
130
-
131
-
132
-
133
-
134
-
135
-
136
-
137
-
138
-
139
-
140
-
141
-
142
-
143
-
144
-
145
-
146
-
147
-
148
-
149
-
150
-
151
-
152
-
153
-
154
 |
 |

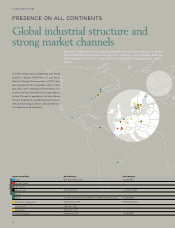
* Ownership ≥ 50%
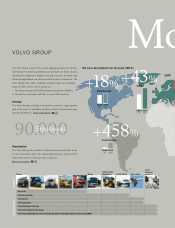
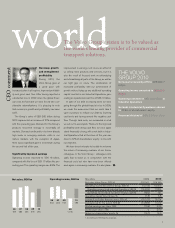
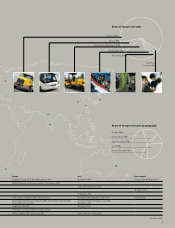
Europe, 39%
North America, 18%
South America, 11%
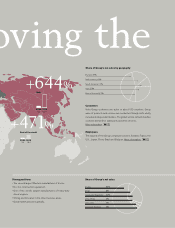
Asia, 25%
Rest of the world, 7%
Share of Group’s net sales by geography
Europe Asia Rest of world
Göteborg, Umeå (SE), Gent (BE), Kaluga (RU) Bangalore (IN) Durban (ZA), Brisbane (AU)
Blainville, Bourg-en-Bresse,Limoges (FR), Kaluga (RU)
Ageo (JP), Hangzhou* (CN)
Brisbane (AU)
Pithampur* (IN)
Borås, Säffle, Uddevalla (SE),Wroclaw (PL) Bangalore (IN), Shanghai*, Xian* (CN) Durban (ZA)
Arvika, Braås, Eskilstuna, Hallsberg (SE), Konz-Könen, Hameln(DE),
Belley (FR), Wroclaw (PL)
Changwon (KR), Shanghai, Linyi* (CN),
Bangalore (IN)
Göteborg, Vara (SE) Shanghai(CN)
Trollhättan, Linköping (SE), Kongsberg (NO)
Köping, Skövde (SE), Vénissieux (FR) Ageo, Kounosu, Hanyu(JP)
Share of Group’s net sales
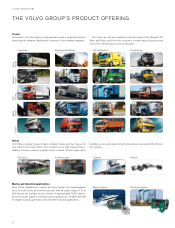
Trucks, 63%
Buses, 8%
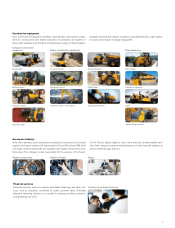
Construction Equipment, 20%
Volvo Penta, 3%
Volvo Aero, 3%
Customer
Finance, 3%
5