Volvo 2007 Annual Report Download - page 44
Download and view the complete annual report
Please find page 44 of the 2007 Volvo annual report below. You can navigate through the pages in the report by either clicking on the pages listed below, or by using the keyword search tool below to find specific information within the annual report.-
 1
1 -
2
-
3
-
4
-
5
-
6
-
7
-
8
-
9
-
10
-
11
-
12
-
13
-
14
-
15
-
16
-
17
-
18
-
19
-
20
-
21
-
22
-
23
-
24
-
25
-
26
-
27
-
28
-
29
-
30
-
31
-
32
-
33
-
 34
34 -
 35
35 -
 36
36 -
 37
37 -
 38
38 -
 39
39 -
 40
40 -
 41
41 -
 42
42 -
 43
43 -
 44
44 -
 45
45 -
 46
46 -
 47
47 -
 48
48 -
 49
49 -
 50
50 -
 51
51 -
 52
52 -
 53
53 -
 54
54 -
55
-
56
-
57
-
58
-
59
-
60
-
61
-
62
-
63
-
64
-
65
-
66
-
67
-
68
-
69
-
70
-
71
-
72
-
73
-
74
-
75
-
76
-
77
-
78
-
79
-
80
-
81
-
82
-
83
-
84
-
85
-
86
-
87
-
88
-
89
-
90
-
91
-
92
-
93
-
94
-
95
-
96
-
97
-
98
-
99
-
100
-
101
-
102
-
103
-
104
-
105
-
106
-
107
-
108
-
109
-
110
-
111
-
112
-
113
-
114
-
115
-
116
-
117
-
118
-
119
-
120
-
121
-
122
-
123
-
124
-
125
-
126
-
127
-
128
-
129
-
130
-
131
-
132
-
133
-
134
-
135
-
136
-
137
-
138
-
139
-
140
-
141
-
142
-
143
-
144
-
145
-
146
-
147
-
148
-
149
-
150
-
151
-
152
-
153
-
154
-
155
-
156
-
157
-
158
-
159
-
160
-
161
-
162
-
163
-
164
-
165
-
166
 |
 |

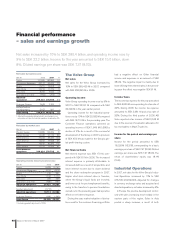
Financial performance
– sales and earnings growth
Net sales increased by 10% to SEK 285.4 billion, and operating income rose by
9% to SEK 22.2 billion. Income for the year amounted to SEK 15.0 billion, down
8%. Diluted earnings per share was SEK 7.37 (8.03).
The Volvo Group
Net sales
Net sales for the Volvo Group increased by
10% to SEK 285,405 M in 2007, compared
with SEK 258,835 M in 2006.
Operating income
Volvo Group operating income rose by 9% in
2007 to SEK 22,231 M compared with SEK
20,399 M in the year-earlier period.
Operating income for the Industrial opera-
tions rose by 10% to SEK 20,583 M compared
with SEK 18,713 M in the preceding year. The
Customer Finance operations achieved an
operating income of SEK 1,649 M (1,686) a
decline of 2%. As a result of the successful
development of the Group in 2007, a provision
of SEK 450 M was made for the Group’s glo-
bal profi t-sharing system.
Net fi nancial items
Net interest expense was SEK 170 M, com-
pared with SEK 81 M in 2006. The increased
interest expense is primarily attributable to
increased debt as a result of acquisitions and
lower interest income due to share dividend
and the share redemption program in 2007.
Higher short-term interest rates in Sweden,
where the Group’s liquid funds are invested,
and lower costs for post-employment benefi ts,
owing to the transfers to pension foundations
carried out in the preceding year, had a positive
effect on net interest expense.
During the year, market valuation of deriva-
tives used for the customer fi nancing portfolio
had a negative effect on Other fi nancial
income and expenses in an amount of SEK
384 M. The negative impact is mainly due to
lower US long-term interest rates. In the preced-
ing year the effect was negative SEK 61 M.
Income Taxes
The income tax expense for the year amounted
to SEK 6,529 M corresponding to a tax rate of
30%. During 2006 the income tax expense
amounted to SEK 3,981 M and a tax rate of
20%. During the third quarter of 2006 AB
Volvo reported a tax income of SEK 2,048 M
due to the reversal of a valuation allowance for
tax receivables in Mack Trucks Inc.
Income for the period and earnings per
share
Income for the period amounted to SEK
15,028 M (16,318), corresponding to a basic
earnings per share of SEK 7.37 (8.04). Diluted
earnings per share was SEK 7.37 (8.03). The
return of shareholders’ equity was 18.1%
(19.6).
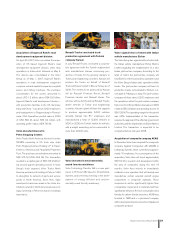
Industrial Operations
In 2007, net sales for the Volvo Group’s Indus-
trial Operations increased by 11% to SEK
276,795 M (249,020). Adjusted for changes
in currency exchange rates and acquired and
divested operations, net sales increased by 4%.
In Europe the positive development contin-
ued with sales increasing most notably in the
eastern parts of the region. Sales in Asia
posted a sharp increase, a result of both
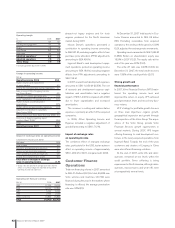
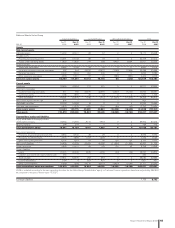
Operating income (loss) by business area
SEK M 2006 2007
Trucks 14,828 15,193
Construction Equipment 4,072 4,218
Buses 745 231
Volvo Penta 1,106 1,173
Volvo Aero 359 529
Eliminations and other (685) (761)
Industrial operations1 20,425 20,583
Goodwill adjustment (1,712) –
Industrial operations 18,713 20,583
Customer Finance 1,686 1,649
Volvo Group 20,399 22,231
1 Excluding goodwill adjustment in 2006.
Net sales by business area
SEK M 2006 2007 %
Trucks 171,265 187,892 10
Construction Equipment 42,131 53,633 27
Buses 17,271 16,608 (4)
Volvo Penta 10,774 11,719 9
Volvo Aero 8,233 7,646 (7)
Eliminations and other (654) (703) (7)
Industrial-
operations1 249,020 276,795 11
Customer Finance 7,648 7,705 1
Reclassifi cations
and eliminations 2,167 905 –
Volvo Group 258,835 285,405 10
1 Adjusted for acquired and divested units and changes in cur-
rency rates, net sales for Industrial operations increased by 4%.
Net sales by market area
SEK M 2006 2007 %
Western Europe 114,689 124,239 8
Eastern Europe 16,042 27,116 69
North America 73,433 49,435 (33)
South America 12,533 15,638 25
Asia 19,610 42,429 116
Other markets 12,713 17,938 41
Total Industrial
operations 249,020 276,795 11
40 Board of Directors’ Report 2007