Vectren 2009 Annual Report Download - page 3
Download and view the complete annual report
Please find page 3 of the 2009 Vectren annual report below. You can navigate through the pages in the report by either clicking on the pages listed below, or by using the keyword search tool below to find specific information within the annual report.-
 1
1 -
 2
2 -
 3
3 -
 4
4 -
 5
5 -
 6
6 -
 7
7 -
 8
8 -
 9
9 -
 10
10 -
 11
11 -
 12
12 -
 13
13 -
 14
14 -
15
-
16
-
17
-
18
-
19
-
20
-
21
-
22
-
23
-
24
-
25
-
26
-
27
-
28
-
29
-
30
-
31
-
32
-
33
-
34
-
35
-
36
-
37
-
38
-
39
-
40
-
41
-
42
-
43
-
44
-
45
-
46
-
47
-
48
-
49
-
50
-
51
-
52
-
53
-
54
-
55
-
56
-
57
-
58
-
59
-
60
-
61
-
62
-
63
-
64
-
65
-
66
-
67
-
68
-
69
-
70
-
71
-
72
-
73
-
74
-
75
-
76
-
77
-
78
-
79
-
80
-
81
-
82
-
83
-
84
-
85
-
86
-
87
-
88
-
89
-
90
-
91
-
92
-
93
-
94
-
95
-
96
-
97
-
98
-
99
-
100
-
101
-
102
-
103
-
104
-
105
-
106
-
107
-
108
-
109
-
110
-
111
-
112
-
113
-
114
-
115
-
116
-
117
-
118
-
119
-
120
-
121
-
122
-
123
-
124
-
125
-
126
-
127
-
128
 |
 |

$1.45
1.40
1.35
1.30
1.25
1.20
1.15
$2.00
1.75
1.50
1.25
1.00
0.75
0.50
Year ended December 31,
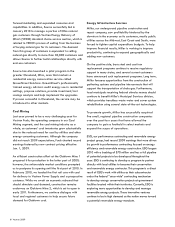
In millions, except per share amounts 2009(1) 2008 2007
Net income $ 133.1 $ 129.0 $ 143.1
Return on average common shareholders’ equity (ROE) 9.7% 10.0% 11.9%
Shares outstanding at year-end 81.1 81.0 76.3
Average shares outstanding for basic earnings 80.7 78.3 75.9
Per Common Share
Basic earnings $ 1.65 $ 1.65 $ 1.89
Dividends paid $ 1.345 $ 1.31 $ 1.27
Annual dividend rate at year-end $ 1.36 $ 1.34 $ 1.30
Book value $ 17.23 $ 16.69 $ 16.17
Market price at year-end $ 24.68 $ 25.01 $ 29.01
(1) Includes an $11.9 million, or $0.15 per share, after-tax charge related to a ProLiance Energy investment in Liberty Gas Storage, LLC.
Basic Earnings
Per Share
07 08 09(1)
$30.00
28.00
26.00
24.00
22.00
20.00
18.00
07 08 09 07 08 09
$24.68
$1.345
$1.65
Financial and Operating Highlights
Dividends Paid
Per Share
Market Price
At Year-End
$1.27
$1.31
$25.01
$29.01
$1.65
$1.89