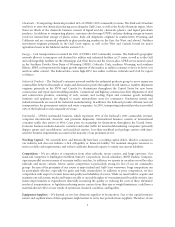
Union Pacific 2005 Annual Report Download - page 21
Download and view the complete annual report
Please find page 21 of the 2005 Union Pacific annual report below. You can navigate through the pages in the report by either clicking on the pages listed below, or by using the keyword search tool below to find specific information within the annual report.
PART II
Item 5. Market for the Registrant’s Common Equity, Related Shareholder Matters, and
Issuer Purchases of Equity Securities
Our common stock is traded on the NYSE under the symbol “UNP”. The following table presents the dividends
declared and the high and low closing prices of our common stock for each of the indicated quarters.
2005 - Dollars Per Share Q1 Q2 Q3 Q4
Dividends ................................................... $ 0.30 $ 0.30 $ 0.30 $ 0.30
Common stock price:
High ..................................................... 70.10 70.19 72.20 81.26
Low...................................................... 58.18 60.85 63.52 66.89
2004 - Dollars Per Share
Dividends ................................................... $ 0.30 $ 0.30 $ 0.30 $ 0.30
Common stock price:
High ..................................................... 69.56 60.47 59.58 67.68
Low...................................................... 59.38 55.66 54.80 58.68
At January 31, 2006, there were 267,584,487 shares of outstanding common stock and 29,173 common
shareholders of record. At that date, the closing price of the common stock on the NYSE was $88.46. We have
paid dividends to our common shareholders during each of the past 106 years. We declared dividends totaling
$316 million in 2005 and $312 million in 2004, and we expect to continue paying comparable dividends in 2006.
We are subject to certain restrictions regarding retained earnings with respect to the payment of cash dividends to
our shareholders. The amount of retained earnings available for dividends increased to $6.2 billion at
December 31, 2005, from $5.2 billion at December 31, 2004.
Purchases of Equity Securities – We do not currently have a formal publicly announced plan or program to
repurchase shares of our common stock. The purchased shares presented below relate solely to our equity
compensation plans described in note 7 to the Financial Statements and Supplementary Data, Item 8. During the
first nine months of 2005, 2,283,918 shares of our common stock were repurchased at an average price per share
of $68.24. The following table presents common stock repurchases during each month for the fourth quarter:
Period
Total
Number
of Shares
Purchased
Average
Price
Paid per
Share
Total Number of Shares
Purchased as Part of a
Publicly Announced
Plan or Program
Maximum Number of
Shares That May Yet
Be Purchased Under
the Plan or Program
Oct. 1 through Oct. 31 Employee
transactions [a] ................ 14,515 $71.66 N/A N/A
Nov. 1 through Nov. 30 Employee
transactions [a] ................ 856,724 75.90 N/A N/A
Dec. 1 through Dec. 31 Employee
transactions [a] ................ 166,625 80.08 N/A N/A
Total ........................... 1,037,864 $76.51 N/A N/A
[a] Includes shares delivered or attested to UPC to pay stock option exercise prices or to satisfy tax withholding obligations for stock option exercises
or vesting of restricted or retention shares.
15


