US Cellular 2013 Annual Report Download - page 15
Download and view the complete annual report
Please find page 15 of the 2013 US Cellular annual report below. You can navigate through the pages in the report by either clicking on the pages listed below, or by using the keyword search tool below to find specific information within the annual report.-
 1
1 -
2
-
3
-
4
-
 5
5 -
 6
6 -
 7
7 -
 8
8 -
 9
9 -
 10
10 -
 11
11 -
 12
12 -
 13
13 -
 14
14 -
 15
15 -
 16
16 -
 17
17 -
 18
18 -
 19
19 -
 20
20 -
 21
21 -
 22
22 -
 23
23 -
 24
24 -
 25
25 -
26
-
27
-
28
-
29
-
30
-
31
-
32
-
33
-
34
-
35
-
36
-
37
-
38
-
39
-
40
-
41
-
42
-
43
-
44
-
45
-
46
-
47
-
48
-
49
-
50
-
51
-
52
-
53
-
54
-
55
-
56
-
57
-
58
-
59
-
60
-
61
-
62
-
63
-
64
-
65
-
66
-
67
-
68
-
69
-
70
-
71
-
72
-
73
-
74
-
75
-
76
-
77
-
78
-
79
-
80
-
81
-
82
-
83
-
84
-
85
-
86
-
87
-
88
 |
 |

United States Cellular Corporation
Management’s Discussion and Analysis of Financial Condition and Results of Operations
(4) Smartphone penetration is calculated by dividing postpaid smartphone customers by total
postpaid customers.
(5) Used only to calculate market penetration of consolidated and core markets and
consolidated and core operating markets, respectively. See footnote (6) below.
(6) Market penetration is calculated by dividing the number of wireless customers at the end of
the period by the total population of consolidated and core markets and consolidated and
core operating markets, respectively, estimated by Claritas.
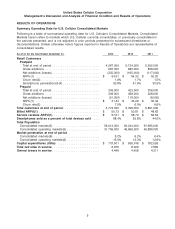
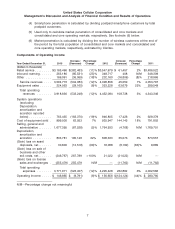
Components of Operating Income
Increase/ Percentage Increase/ Percentage
Year Ended December 31, 2013 (Decrease) Change 2012 (Decrease) Change 2011
(Dollars in thousands)
Retail service ......... $3,165,496 $(382,483) (11)% $3,547,979 $ 61,457 2% $3,486,522
Inbound roaming ...... 263,186 (85,531) (25)% 348,717 408 N/M 348,309
Other .............. 166,091 (36,069) (18)% 202,160 (16,806) (8)% 218,966
Service revenues .... 3,594,773 (504,083) (12)% 4,098,856 45,059 1% 4,053,797
Equipment sales ...... 324,063 (29,165) (8)% 353,228 63,679 22% 289,549
Total operating
revenues ........ 3,918,836 (533,248) (12)% 4,452,084 108,738 3% 4,343,346
System operations
(excluding
Depreciation,
amortization and
accretion reported
below) ............ 763,435 (183,370) (19)% 946,805 17,426 2% 929,379
Cost of equipment sold . 999,000 63,053 7% 935,947 144,145 18% 791,802
Selling, general and
administrative ....... 1,677,395 (87,538) (5)% 1,764,933 (4,768) N/M 1,769,701
Depreciation,
amortization and
accretion .......... 803,781 195,148 32% 608,633 35,076 6% 573,557
(Gain) loss on asset
disposals, net ....... 30,606 (12,518) (69)% 18,088 (8,199) (83)% 9,889
(Gain) loss on sale of
business and other
exit costs, net ....... (246,767) 267,789 >100% 21,022 (21,022) N/M —
(Gain) loss on license
sales and exchanges . (255,479) 255,479 N/M — (11,762) N/M (11,762)
Total operating
expenses ........ 3,771,971 (523,457) (12)% 4,295,428 232,862 6% 4,062,566
Operating income ..... $ 146,865 $ (9,791) (6)% $ 156,656 $(124,124) (44)% $ 280,780
N/M—Percentage change not meaningful
7