US Bank 2013 Annual Report Download - page 4
Download and view the complete annual report
Please find page 4 of the 2013 US Bank annual report below. You can navigate through the pages in the report by either clicking on the pages listed below, or by using the keyword search tool below to find specific information within the annual report.-
 1
1 -
 2
2 -
 3
3 -
 4
4 -
 5
5 -
 6
6 -
 7
7 -
 8
8 -
 9
9 -
 10
10 -
 11
11 -
 12
12 -
 13
13 -
 14
14 -
 15
15 -
16
-
17
-
18
-
19
-
20
-
21
-
22
-
23
-
24
-
25
-
26
-
27
-
28
-
29
-
30
-
31
-
32
-
33
-
34
-
35
-
36
-
37
-
38
-
39
-
40
-
41
-
42
-
43
-
44
-
45
-
46
-
47
-
48
-
49
-
50
-
51
-
52
-
53
-
54
-
55
-
56
-
57
-
58
-
59
-
60
-
61
-
62
-
63
-
64
-
65
-
66
-
67
-
68
-
69
-
70
-
71
-
72
-
73
-
74
-
75
-
76
-
77
-
78
-
79
-
80
-
81
-
82
-
83
-
84
-
85
-
86
-
87
-
88
-
89
-
90
-
91
-
92
-
93
-
94
-
95
-
96
-
97
-
98
-
99
-
100
-
101
-
102
-
103
-
104
-
105
-
106
-
107
-
108
-
109
-
110
-
111
-
112
-
113
-
114
-
115
-
116
-
117
-
118
-
119
-
120
-
121
-
122
-
123
-
124
-
125
-
126
-
127
-
128
-
129
-
130
-
131
-
132
-
133
-
134
-
135
-
136
-
137
-
138
-
139
-
140
-
141
-
142
-
143
-
144
-
145
-
146
-
147
-
148
-
149
-
150
-
151
-
152
-
153
-
154
-
155
-
156
-
157
-
158
-
159
-
160
-
161
-
162
-
163
 |
 |

2 U.S. BANCORP
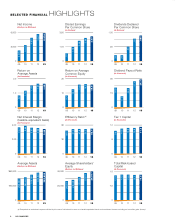
Net Income
(Dollars in Millions)
6,000
3,000
0
09 10 11 12 13
2,205
3,317
4,872
5,647
5,836
Return on
Average Assets
(In Percents)
2.0
1.0
0
09 10 11 12 13
.8 2
1 .1 6
1 .5 3
1 .6 5
1.65
Net Interest Margin
(taxable-equivalent basis)
(In Percents)
4.00
2.00
0
09 10 11 12 13
3.67
3.88
3.65
3.58
3.44
Average Assets
(Dollars in Millions)
360,000
180,000
0
09 10 11 12 13
268,360
285,861
318,264
342,849
352,680
Diluted Earnings
Per Common Share
(In Dollars)
3.50
1.75
0
09 10 11 12 13
.97
1.73
2.46
2.84
3.00
Return on Average
Common Equity
(In Percents)
20
10
0
09 10 11 12 13
8.2
12.7
15.8
16.2
15.8
Efficiency Ratio(a)
(In Percents)
60
30
0
09 10 11 12 13
48.4
51.5
51.8
51.5
52.4
Average Shareholders’
Equity
(Dollars in Millions)
40,000
20,000
0
09 10 11 12 13
26,307
28,049
32,200
37,611
39,917
Dividends Declared
Per Common Share
(In Dollars)
1.00
.50
0
09 10 11 12 13
.20
.20
.50
.78
.885
Dividend Payout Ratio
(In Percents)
30
15
0
09 10 11 12 13
20.6
11.5
20.2
27.4
29.3
Tier 1 Capital
(In Percents)
12
6
0
09 10 11 12 13
9.6
10.5
10.8
10.8
11.2
Total Risk-based
Capital
(In Percents)
15
7.5
0
09 10 11 12 13
12.9
13.3
13.3
13.1
13.2
(a) Computed as noninterest expense divided by the sum of net interest income on a taxable-equivalent basis and noninterest income excluding net securities gains (losses).
SELECTED FINANCIAL HIGHLIGHTS