Tyson Foods 2008 Annual Report Download - page 55
Download and view the complete annual report
Please find page 55 of the 2008 Tyson Foods annual report below. You can navigate through the pages in the report by either clicking on the pages listed below, or by using the keyword search tool below to find specific information within the annual report.-
 1
1 -
2
-
3
-
4
-
5
-
6
-
7
-
8
-
9
-
10
-
11
-
12
-
13
-
14
-
15
-
16
-
17
-
18
-
19
-
20
-
21
-
22
-
23
-
24
-
25
-
26
-
27
-
28
-
29
-
30
-
31
-
32
-
33
-
34
-
35
-
36
-
37
-
38
-
39
-
40
-
41
-
42
-
43
-
44
-
 45
45 -
 46
46 -
 47
47 -
 48
48 -
 49
49 -
 50
50 -
 51
51 -
 52
52 -
 53
53 -
 54
54 -
 55
55 -
 56
56 -
 57
57 -
 58
58 -
 59
59 -
 60
60 -
 61
61 -
 62
62 -
 63
63 -
 64
64 -
 65
65 -
66
-
67
-
68
-
69
-
70
-
71
-
72
 |
 |

53 2008 Annual Report
Notes to Consolidated Financial Statements (continued)
A foreign subsidiary pension plan had $15 million and $17 million in plan
assets at September 27, 2008, and September 29, 2007, respectively.
All of this plan’s assets are held in annuity contracts consistent with
its target asset allocation.
The Plan Trustees have established a set of investment objectives
related to the assets of the pension plans and regularly monitor the
performance of the funds and portfolio managers. Objectives for
the pension assets are (1) to provide growth of capital and income,
(2) to achieve a target weighted average annual rate of return com-
petitive with other funds with similar investment objectives and
(3) to diversify to reduce risk. The investment objectives and target
asset allocation were adopted in January 2004 and amended in
January 2008.
CONTRIBUTIONS
Our policy is to fund at least the minimum contribution required
to meet applicable federal employee benefi t and local tax laws.
In our sole discretion, we may from time to time fund additional
amounts. Expected contributions to pension plans for fi scal 2009
are approximately $2 million. For fi scal 2008, 2007 and 2006, we
funded $2 million, $5 million and $0, respectively, to defi ned
benefi t plans.
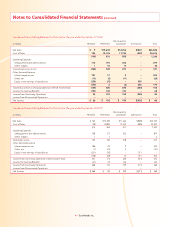
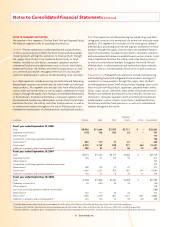
ESTIMATED FUTURE BENEFIT PAYMENTS
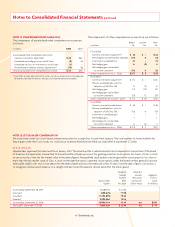
The following benefi t payments are expected to be paid:
Other
Pension Benefi ts Postretirement
in millions Qualifi ed Non-Qualifi ed Benefi ts
2009 $ 6 $ 1 $ 6
2010 7 2 6
2011 6 2 6
2012 7 2 5
2013 12 2 5
2014–2018 33 16 22
The above benefi t payments for other postretirement benefi t plans
are not expected to be offset by Medicare Part D subsidies in 2009
or thereafter.
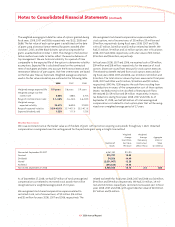
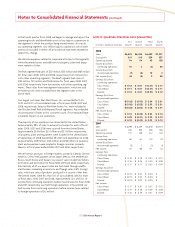
NOTE 14: SUPPLEMENTAL CASH FLOW INFORMATION
The following table summarizes cash payments for interest and
income taxes:
in millions 2008 2007 2006
Interest $211 $262 $159
Income taxes, net of refunds 51 97 144
NOTE 15: TRANSACTIONS WITH RELATED PARTIES
We have operating leases for farms, equipment and other facilities
with Don Tyson, a director of the Company, John Tyson, Chairman of
the Company, certain members of their families and the Randal W.
Tyson Testamentary Trust. Total payments of $3 million in fi scal 2008,
$5 million in fi scal 2007, and $8 million in fi scal 2006, were paid to
entities in which these parties had an ownership interest.
In 2008, a lawsuit captioned In re Tyson Foods, Inc. Consolidated
Shareholder’s Litigation was settled. Pursuant to the settlement,
Don Tyson and the Tyson Limited Partnership paid us $4.5 million.
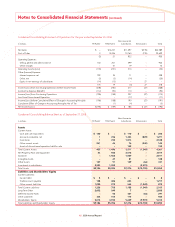
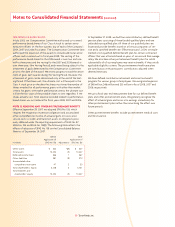
NOTE 16: INCOME TAXES
Detail of the provision (benefi t) for income taxes from continuing
operations consists of:
in millions 2008 2007 2006
Federal $56 $129 $ (79)
State 8 16 (12)
Foreign 4 (3) (3)
$68 $142 $ (94)
Current $33 $137 $ 32
Deferred 35 5 (126)
$68 $142 $ (94)
The reasons for the difference between the statutory federal income
tax rate and the effective income tax rate from continuing operations
are as follows:
2008 2007 2006
Federal income tax rate 35.0% 35.0% 35.0%
State income taxes, excluding FIN 48 2.0 2.3 3.3
Extraterritorial income exclusion – (1.1) –
Unrecognized tax benefi ts, net 4.4 (4.6) –
Medicare Part D (0.8) 3.2 (1.8)
Adjustment for tax review – – (5.1)
General business credits (3.8) (2.6) 2.6
Domestic production deduction (2.2) (1.0) –
Fixed asset tax cost correction – 4.2 –
Offi cers life insurance 3.8 (1.4) 0.8
Change in state valuation allowance 5.0 – –
Other 1.2 0.6 0.2
44.6% 34.6% 35.0%