Travelers 2010 Annual Report Download - page 193
Download and view the complete annual report
Please find page 193 of the 2010 Travelers annual report below. You can navigate through the pages in the report by either clicking on the pages listed below, or by using the keyword search tool below to find specific information within the annual report.-
 1
1 -
2
-
3
-
4
-
5
-
6
-
7
-
8
-
9
-
10
-
11
-
12
-
13
-
14
-
15
-
16
-
17
-
18
-
19
-
20
-
21
-
22
-
23
-
24
-
25
-
26
-
27
-
28
-
29
-
30
-
31
-
32
-
33
-
34
-
35
-
36
-
37
-
38
-
39
-
40
-
41
-
42
-
43
-
44
-
45
-
46
-
47
-
48
-
49
-
50
-
51
-
52
-
53
-
54
-
55
-
56
-
57
-
58
-
59
-
60
-
61
-
62
-
63
-
64
-
65
-
66
-
67
-
68
-
69
-
70
-
71
-
72
-
73
-
74
-
75
-
76
-
77
-
78
-
79
-
80
-
81
-
82
-
83
-
84
-
85
-
86
-
87
-
88
-
89
-
90
-
91
-
92
-
93
-
94
-
95
-
96
-
97
-
98
-
99
-
100
-
101
-
102
-
103
-
104
-
105
-
106
-
107
-
108
-
109
-
110
-
111
-
112
-
113
-
114
-
115
-
116
-
117
-
118
-
119
-
120
-
121
-
122
-
123
-
124
-
125
-
126
-
127
-
128
-
129
-
130
-
131
-
132
-
133
-
134
-
135
-
136
-
137
-
138
-
139
-
140
-
141
-
142
-
143
-
144
-
145
-
146
-
147
-
148
-
149
-
150
-
151
-
152
-
153
-
154
-
155
-
156
-
157
-
158
-
159
-
160
-
161
-
162
-
163
-
164
-
165
-
166
-
167
-
168
-
169
-
170
-
171
-
172
-
173
-
174
-
175
-
176
-
177
-
178
-
179
-
180
-
181
-
182
-
 183
183 -
 184
184 -
 185
185 -
 186
186 -
 187
187 -
 188
188 -
 189
189 -
 190
190 -
 191
191 -
 192
192 -
 193
193 -
 194
194 -
 195
195 -
 196
196 -
 197
197 -
 198
198 -
 199
199 -
 200
200 -
 201
201 -
 202
202 -
 203
203 -
204
-
205
-
206
-
207
-
208
-
209
-
210
-
211
-
212
-
213
-
214
-
215
-
216
-
217
-
218
-
219
-
220
-
221
-
222
-
223
-
224
-
225
-
226
-
227
-
228
-
229
-
230
-
231
-
232
-
233
-
234
-
235
-
236
-
237
-
238
-
239
-
240
-
241
-
242
-
243
-
244
-
245
-
246
-
247
-
248
-
249
-
250
-
251
-
252
-
253
-
254
-
255
-
256
-
257
-
258
-
259
-
260
-
261
-
262
-
263
-
264
-
265
-
266
-
267
-
268
-
269
-
270
-
271
-
272
-
273
-
274
-
275
-
276
-
277
-
278
-
279
-
280
-
281
-
282
-
283
-
284
-
285
-
286
-
287
-
288
-
289
-
290
-
291
-
292
 |
 |

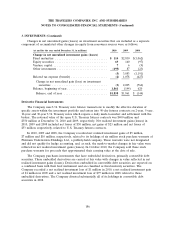
THE TRAVELERS COMPANIES, INC. AND SUBSIDIARIES
NOTES TO CONSOLIDATED FINANCIAL STATEMENTS (Continued)
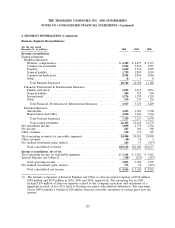
3. INVESTMENTS (Continued)
amounts reported in the Company’s consolidated balance sheet and any unfunded commitment. Neither
the carrying amounts nor the unfunded commitments related to these VIEs are material.
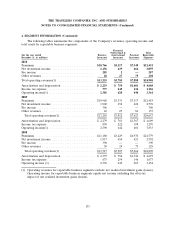
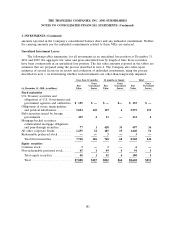
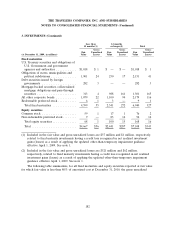
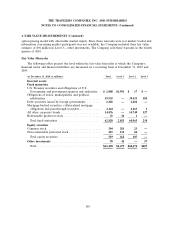
Unrealized Investment Losses
The following tables summarize, for all investments in an unrealized loss position at December 31,
2010 and 2009, the aggregate fair value and gross unrealized loss by length of time those securities
have been continuously in an unrealized loss position. The fair value amounts reported in the tables are
estimates that are prepared using the process described in note 4. The Company also relies upon
estimates of several factors in its review and evaluation of individual investments, using the process
described in note 1, in determining whether such investments are other-than-temporarily impaired.
Less than 12 months 12 months or longer Total
Gross Gross Gross
Fair Unrealized Fair Unrealized Fair Unrealized
(at December 31, 2010, in millions) Value Losses Value Losses Value Losses
Fixed maturities
U.S. Treasury securities and
obligations of U.S. Government and
government agencies and authorities $ 155 $ — $ — $— $ 155 $ —
Obligations of states, municipalities
and political subdivisions ......... 5,854 149 139 6 5,993 155
Debt securities issued by foreign
governments .................. 419 4 13 — 432 4
Mortgage-backed securities,
collateralized mortgage obligations
and pass-through securities ....... 77 1 420 35 497 36
All other corporate bonds ......... 1,255 32 185 19 1,440 51
Redeemable preferred stock ........ ——3— 3—
Total fixed maturities ........... 7,760 186 760 60 8,520 246
Equity securities
Common stock .................. 3—3— 6—
Non-redeemable preferred stock ..... 45 1 49 4 94 5
Total equity securities ........... 48 1 52 4 100 5
Total ....................... $7,808 $187 $812 $64 $8,620 $251
181