Toyota 2005 Annual Report Download - page 5
Download and view the complete annual report
Please find page 5 of the 2005 Toyota annual report below. You can navigate through the pages in the report by either clicking on the pages listed below, or by using the keyword search tool below to find specific information within the annual report.-
 1
1 -
 2
2 -
 3
3 -
 4
4 -
 5
5 -
 6
6 -
 7
7 -
 8
8 -
 9
9 -
 10
10 -
 11
11 -
 12
12 -
 13
13 -
 14
14 -
 15
15 -
 16
16 -
17
-
18
-
19
-
20
-
21
-
22
-
23
-
24
-
25
-
26
-
27
-
28
-
29
-
30
-
31
-
32
-
33
-
34
-
35
-
36
-
37
-
38
-
39
-
40
-
41
-
42
-
43
-
44
-
45
-
46
-
47
-
48
-
49
-
50
-
51
-
52
-
53
-
54
-
55
-
56
-
57
-
58
-
59
-
60
-
61
-
62
-
63
-
64
-
65
-
66
-
67
-
68
-
69
-
70
-
71
-
72
-
73
-
74
-
75
-
76
-
77
-
78
-
79
-
80
-
81
-
82
-
83
-
84
-
85
-
86
-
87
-
88
-
89
-
90
-
91
-
92
-
93
-
94
-
95
-
96
-
97
-
98
-
99
-
100
-
101
-
102
-
103
-
104
-
105
-
106
-
107
-
108
-
109
-
110
-
111
-
112
-
113
-
114
-
115
-
116
-
117
-
118
-
119
-
120
-
121
-
122
-
123
-
124
-
125
-
126
-
127
-
128
-
129
-
130
-
131
-
132
-
133
-
134
-
135
-
136
-
137
-
138
 |
 |

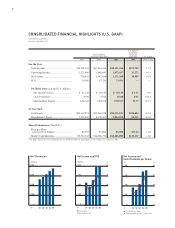
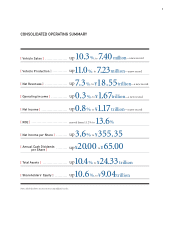
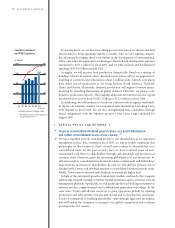
Note: All of the above are year-on-year consolidated results.
3
CONSOLIDATED OPERATING SUMMARY
[Vehicle Sales ].................. up 10.3%, to 7.4 0 million—a new record
[Vehicle Production ]............ up11.0 %,to 7.23million—a new record
[Net Revenues ].................. up 7.3 %, to ¥18.55trillion—a new record
[Operating Income ]............. up 0.3%, to ¥1.67trillion—a new record
[Net Income ]..................... up 0.8%, to ¥1.17 trillion—a new record
[ROE ]............................. moved from 15.2% to 13.6%
[Net Income per Share ]......... up 3.6%, to ¥355.35
[Annual Cash Dividends
per Share ] ......... up ¥20.00, to ¥65.00
[Total Assets ].................... up10.4 %, to ¥24.33 trillion
[Shareholders’ Equity ].......... up10.6%, to ¥9.04trillion