Toshiba 1998 Annual Report Download - page 3
Download and view the complete annual report
Please find page 3 of the 1998 Toshiba annual report below. You can navigate through the pages in the report by either clicking on the pages listed below, or by using the keyword search tool below to find specific information within the annual report.-
 1
1 -
 2
2 -
 3
3 -
 4
4 -
 5
5 -
 6
6 -
 7
7 -
 8
8 -
 9
9 -
 10
10 -
 11
11 -
 12
12 -
 13
13 -
 14
14 -
15
-
16
-
17
-
18
-
19
-
20
-
21
-
22
-
23
-
24
-
25
-
26
-
27
-
28
-
29
-
30
-
31
-
32
-
33
-
34
-
35
-
36
-
37
-
38
-
39
-
40
-
41
-
42
-
43
-
44
-
45
-
46
-
47
-
48
-
49
-
50
-
51
-
52
-
53
-
54
-
55
-
56
-
57
-
58
 |
 |

Toshiba Corporation Annual Report 1998 1.
Thousands of
Million s of yen U.S. dollars
1998 1997 1998
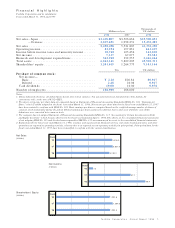
Net sales – Japan . . . . . . . . . . . . . . . . . . . . . . . . . . . . . . . . . . ¥3,418,807 ¥3,523,636 $25,900,053
– Overseas . . . . . . . . . . . . . . . . . . . . . . . . . . . . . . . 2,039,691 1,998,251 15,452,205
Net sales . . . . . . . . . . . . . . . . . . . . . . . . . . . . . . . . . . . . . . . . 5,458,498 5,521,887 41,352,258
Operating income . . . . . . . . . . . . . . . . . . . . . . . . . . . . . . . . . 82,294 197,831 623,439
In com e before incom e taxes an d m inority interest . . . . . . . 18,748 125,456 142,030
Net income . . . . . . . . . . . . . . . . . . . . . . . . . . . . . . . . . . . . . . 7,337 67,077 55,583
Research and developmen t expenditures. . . . . . . . . . . . . . . 322,928 332,555 2,446,424
Total assets . . . . . . . . . . . . . . . . . . . . . . . . . . . . . . . . . . . . . . 6,062,141 5,809,285 45,925,311
Shareholders’ equity . . . . . . . . . . . . . . . . . . . . . . . . . . . . . . . 1,201,615 1,264,775 9,103,144
Yen U.S. dollars
Per share of common stock:
Net in com e—
Basic . . . . . . . . . . . . . . . . . . . . . . . . . . . . . . . . . . . . . . . . ¥ 2.28 ¥20.84 $0.017
Diluted . . . . . . . . . . . . . . . . . . . . . . . . . . . . . . . . . . . . . . 2.28 20.06 0.017
Cash dividends . . . . . . . . . . . . . . . . . . . . . . . . . . . . . . . . . 10.00 10.00 0.076
Number of employees . . . . . . . . . . . . . . . . . . . . . . . . . . . . . 186,000 186,000
Notes:
1. Unless indicated otherwise, all dollar figures herein refer to U.S. currency. Yen amounts have been translated into U.S. dollars, for
convenience only, at the rate of ¥132=US$1.
2. The above net income per share data are computed based on Statement of Financial Accounting Standards (SFAS) No. 128, “Earnings per
Share,” which Toshiba adopted in the fiscal year ended March 31, 1998. Net income per share data for the fiscal year ended March 31, 1997
have been restated to conform with SFAS No. 128. Basic earnings per share is computed based on the weighted-average number of shares of
comm on stock outstanding during the period. Diluted earnings per share assumes the dilution that would occur if dilutive convertible
debentures were converted into common stock.
3. The company has not adopted Statement of Financial Accounting Standards (SFAS) No. 115 “Accounting for Certain Investm ents in Debt
and Equity Securities” which became effective for the fiscal year beginning April 1, 1994. The effects on the consolidated financial statements
of not adopting SFAS No. 115 and the disclosures required by SFAS No. 115 are summarized in a note to the consolidated financial statements.
4. Beginning with the fiscal year ended March 31, 1998, revenues and expenses from financial services, real estate leasing and sales, and other
operations are reported as operating activities, whereas they were reported as non-operating activities in prior periods. Prior-period data for the
fiscal year ended March 31, 1997 have been reclassified to conform with the current classification.
Financial Highlights
Toshiba Corporation and its subsidiaries
Years ended March 31, 1998 and 1997
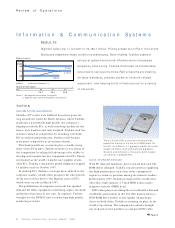
Net Sales
(¥ billion)
Net Income
(¥ billion)
Shareholders’ Equity
(¥ billion)
March
5,458.5
5,521.9
5,192.2
98
97
96
March
7.3
67.1
90.4
98
97
96
March
1,201.6
1,264.8
1,202.3
98
97
96