Toro 2009 Annual Report Download - page 4
Download and view the complete annual report
Please find page 4 of the 2009 Toro annual report below. You can navigate through the pages in the report by either clicking on the pages listed below, or by using the keyword search tool below to find specific information within the annual report.-
 1
1 -
 2
2 -
 3
3 -
 4
4 -
 5
5 -
 6
6 -
 7
7 -
 8
8 -
 9
9 -
 10
10 -
 11
11 -
 12
12 -
 13
13 -
 14
14 -
 15
15 -
16
-
17
-
18
-
19
-
20
-
21
-
22
-
23
-
24
-
25
-
26
-
27
-
28
-
29
-
30
-
31
-
32
-
33
-
34
-
35
-
36
-
37
-
38
-
39
-
40
-
41
-
42
-
43
-
44
-
45
-
46
-
47
-
48
-
49
-
50
-
51
-
52
-
53
-
54
-
55
-
56
-
57
-
58
-
59
-
60
-
61
-
62
-
63
-
64
-
65
-
66
-
67
-
68
-
69
-
70
-
71
-
72
-
73
-
74
-
75
-
76
-
77
-
78
 |
 |

Driven by Innovation
As we saw the signals of market contraction, we were
determined to stay focused on the needs of our
customers and seize the opportunity to gain market
share. One of the best ways to do this was to further
leverage our commitment to customer-valued innovation,
where we once again introduced our highest level of
new products in recent history. While products alone
could not fully counter the recession, they truly made a
difference in helping us take share in most of our markets.
In the residential segment, we launched a new line of
Toro® and Lawn-Boy® walk power mowers across a
broader range of price points that resulted in signifi cant
share growth. Another area of strong customer
acceptance came from our redesigned platform of Toro
TITAN® zero-turn mowers. For professional customers,
we entered an entirely new product category with the
introduction of the Toro Grand Stand™ stand-on mower
to expand our offering to landscape contractors. We
advanced our position in water management with
several breakthrough irrigation technologies, including
Toro’s Precision™ Series spray nozzles that reduce water
usage by up to 30 percent. And, we made our Toro
Workman® HD Series utility vehicle even better with
unmatched towing and hauling capacity. We expect
these and other industry-leading advancements to
continue to build momentum in the marketplace, and
our ongoing engineering investments mean even more
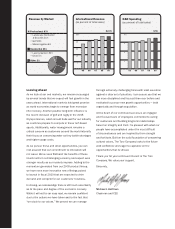
innovation is on the way. While we needed to adjust
R&D spending for the year due to contracting revenues,
our spending as a percentage of sales was up slightly
for fi scal 2009.
In addition to our innovative products, we continue to
earn the trust of customers around the world who value
our brands, our people and our service. For example,
we established new or expanded relationships with
the U.S. Army, Hilton Golf, Trump Golf, Shanghai Expo
Park, Glasgow’s Hampden Park and our hometown
Minnesota Twins — among many others. We also were
recognized by The Home Depot® as “Supplier of the
Year” in the lawn and garden category. Achieving this
prestigious award is the result of our quality products,
expert supply chain management team and genuine
business partnership. We are grateful for all of our
customer relationships and strive to earn their business
each and every day.
Striking the Right Balance
In response to the decline in demand, we took immediate
action in several critical areas to weather the short-term
challenges without impeding the long-term health of
the organization. To move our cost structure in the
necessary direction, we reduced our overall workforce
by approximately 15 percent from the previous year.
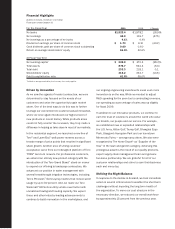
Financial Highlights
(dollars in millions, except per share data)
Fiscal years ended October 31
For the Fiscal Year 2009 2008 % Change
Net sales $1,523.4 $1,878.2 (18.9)%
Net earnings 62.8 119.7 (47.5)
Net earnings as a percentage of net sales 4.1% 6.4%
Diluted net earnings per share of common stock $ 1.73 $ 3.10 (44.2)
Cash dividends paid per share of common stock outstanding 0.60 0.60
Return on average stockholders’ equity 18.5% 32.6%
At Fiscal Year End
Net working capital* $ 228.9 $ 370.3 (38.2)%
Total assets 872.7 932.3 (6.4)
Total debt 233.3 233.1 0.1
Stockholders’ equity 315.2 364.7 (13.6)
Debt-to-capitalization ratio 42.5% 39.0%
*Defi ned as average receivables plus inventory, less trade payables