Thrifty Car Rental 2011 Annual Report Download - page 52
Download and view the complete annual report
Please find page 52 of the 2011 Thrifty Car Rental annual report below. You can navigate through the pages in the report by either clicking on the pages listed below, or by using the keyword search tool below to find specific information within the annual report.-
 1
1 -
2
-
3
-
4
-
5
-
6
-
7
-
8
-
9
-
10
-
11
-
12
-
13
-
14
-
15
-
16
-
17
-
18
-
19
-
20
-
21
-
22
-
23
-
24
-
25
-
26
-
27
-
28
-
29
-
30
-
31
-
32
-
33
-
34
-
35
-
36
-
37
-
38
-
39
-
40
-
41
-
 42
42 -
 43
43 -
 44
44 -
 45
45 -
 46
46 -
 47
47 -
 48
48 -
 49
49 -
 50
50 -
 51
51 -
 52
52 -
 53
53 -
 54
54 -
 55
55 -
 56
56 -
 57
57 -
 58
58 -
 59
59 -
 60
60 -
 61
61 -
 62
62 -
63
-
64
-
65
-
66
-
67
-
68
-
69
-
70
-
71
-
72
-
73
-
74
-
75
-
76
-
77
-
78
-
79
-
80
-
81
-
82
-
83
-
84
-
85
-
86
-
87
-
88
-
89
-
90
-
91
-
92
-
93
-
94
-
95
-
96
-
97
-
98
-
99
-
100
-
101
-
102
-
103
-
104
-
105
-
106
-
107
-
108
-
109
-
110
-
111
-
112
-
113
-
114
-
115
-
116
-
117
-
118
 |
 |

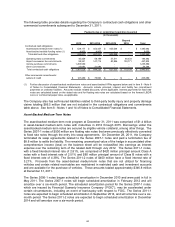
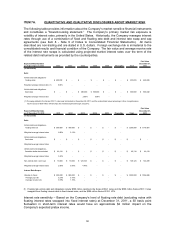
ITEM 7A. QUANTITATIVE AND QUALITATIVE DISCLOSURES ABOUT MARKET RISK
The following table provides information about the Company’s market sensitive financial instruments
and constitutes a “forward-looking statement.” The Company’s primary market risk exposure is
volatility of interest rates, primarily in the United States. Historically, the Company manages interest
rates through use of a combination of fixed and floating rate debt and interest rate swap and cap
agreements (see Item 8 - Note 9 of Notes to Consolidated Financial Statements). All items
described are non-trading and are stated in U.S. dollars. Foreign exchange risk is immaterial to the
consolidated results and financial condition of the Company. The fair value and average receive rate
of the interest rate swaps is calculated using projected market interest rates over the term of the
related debt instruments as provided by the counterparties.
Fair Value
Expected Maturity Dates December 31,
as of December 31, 2011 2012 2013 2014 2015 2016 Thereafter Total 2011
(in thousands)
Debt:
Vehicle debt and obligations-
floating rates 500,000$ -$ -$ -$ -$ -$ 500,000$ 495,820$
Weighted average interest rates (1) 0.80% - - - - -
Vehicle debt and obligations-
fixed rates -$ -$ 400,000$ 500,000$ -$ -$ 900,000$ 899,292$
Weighted average interest rates - - 2.88% 3.08% - -
(1) The swap related to the Series 2007-1 notes was terminated on December 28, 2011 and the unamortized value remaining in other comprehensive
income (loss) of $8.8 million will amortize into interest expense through July 2012.
Fair Value
Expected Maturity Dates December 31,
as of December 31, 2010 2011 2012 2013 2014 2015 Thereafter Total 2010
(in thousands)
Debt:
Vehicle debt and obligations-
floating rates (1) 500,000$ 700,000$ -$ -$ -$ -$ 1,200,000$ 1,178,875$
Weighted average interest rates 0.80% 2.13% - - - -
Vehicle debt and obligations-
fixed rates -$ -$ -$ -$ -$ -$ -$ -$
Weighted average interest rates - - - - - -
Vehicle debt and obligations-
Canadian dollar denominated 49,118$ -$ -$ -$ -$ -$ 49,118$ 49,118$
Weighted average interest rates 3.43% - - - - -
Non-vehicle debt - term loan 10,000$ 10,000$ 128,125$ -$ -$ -$ 148,125$ 146,459$
Weighted average interest rates 2.89% 3.60% 4.70% - - -
Interest Rate Swaps:
Variable to Fixed 500,000$ 500,000$ -$ -$ -$ -$ 1,000,000$ 1,036,888$
Average pay rate 5.27% 5.16% - - - -
Average receive rate 0.39% 1.10% - - - -
(1) Floating rate vehicle debt and obligations include $500 million relating to the Series 2006-1 notes and the $500 million Series 2007-1 notes
swapped from floating interest rates to fixed interest rates, and the $200 million Series 2010-1 VFN.
Interest rate sensitivity – Based on the Company’s level of floating rate debt (excluding notes with
floating interest rates swapped into fixed interest rates) at December 31, 2011, a 50 basis point
fluctuation in short-term interest rates would have an approximate $2 million impact on the
Company’s expected pretax income.
50