Thrifty Car Rental 2010 Annual Report Download - page 61
Download and view the complete annual report
Please find page 61 of the 2010 Thrifty Car Rental annual report below. You can navigate through the pages in the report by either clicking on the pages listed below, or by using the keyword search tool below to find specific information within the annual report.-
 1
1 -
2
-
3
-
4
-
5
-
6
-
7
-
8
-
9
-
10
-
11
-
12
-
13
-
14
-
15
-
16
-
17
-
18
-
19
-
20
-
21
-
22
-
23
-
24
-
25
-
26
-
27
-
28
-
29
-
30
-
31
-
32
-
33
-
34
-
35
-
36
-
37
-
38
-
39
-
40
-
41
-
42
-
43
-
44
-
45
-
46
-
47
-
48
-
49
-
50
-
 51
51 -
 52
52 -
 53
53 -
 54
54 -
 55
55 -
 56
56 -
 57
57 -
 58
58 -
 59
59 -
 60
60 -
 61
61 -
 62
62 -
 63
63 -
 64
64 -
 65
65 -
 66
66 -
 67
67 -
 68
68 -
 69
69 -
 70
70 -
 71
71 -
72
-
73
-
74
-
75
-
76
-
77
-
78
-
79
-
80
-
81
-
82
-
83
-
84
-
85
-
86
-
87
-
88
-
89
-
90
-
91
-
92
-
93
-
94
-
95
-
96
-
97
-
98
-
99
-
100
-
101
-
102
-
103
-
104
-
105
-
106
-
107
-
108
-
109
-
110
-
111
-
112
-
113
-
114
-
115
-
116
-
117
 |
 |

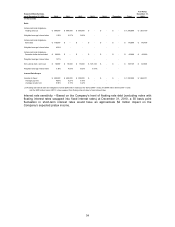
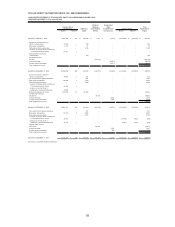
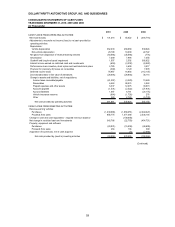
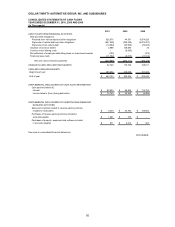
DOLLAR THRIFTY AUTOMOTIVE GROUP, INC. AND SUBSIDIARIES
CONSOLIDATED STATEMENTS OF CASH FLOWS
YEAR ENDED DECEMBER 31, 2010, 2009 AND 2008
(In Thousands)
2010 2009 2008
CASH FLOWS FROM FINANCING ACTIVITIES:
Debt and other obligations:
Proceeds from vehicle debt and other obligations 526,876 44,781 9,874,526
Payments of vehicle debt and other obligations (847,448) (785,225) (9,972,227)
Payments of non-vehicle debt (10,000) (20,000) (70,625)
Issuance of common shares 2,988 129,583 33
Common stock offering costs - (6,635) -
Net settlement of employee withholding taxes on share-based awards (722) - (373)
Financing issue costs (11,792) (6,615) (11,512)
Net cash used in financing activities (340,098) (644,111) (180,178)
CHANGE IN CASH AND CASH EQUIVALENTS 62,749 170,768 128,611
CASH AND CASH EQUIVALENTS:
Beginning of year 400,404 229,636 101,025
End of year 463,153$ 400,404$ 229,636$
SUPPLEMENTAL DISCLOSURES OF CASH FLOW INFORMATION:
Cash paid for/(refund of):
Interest 82,923$ 96,569$ 114,753$
Income taxes to (from) taxing authorities 74,745$ 22,350$ (8,486)$
SUPPLEMENTAL DISCLOSURES OF INVESTING AND FINANCING
NONCASH ACTIVITIES:
Sales and incentives related to revenue-earning vehicles
included in receivables 5,340$ 33,704$ 158,952$
Purchases of revenue-earning vehicles included in
accounts payable 1,261$ 370$ -$
Purchases of property, equipment and software included
in accounts payable 671$ 2,914$ 924$
See notes to consolidated financial statements.
(Concluded)
60