Sunbeam 2001 Annual Report Download - page 3
Download and view the complete annual report
Please find page 3 of the 2001 Sunbeam annual report below. You can navigate through the pages in the report by either clicking on the pages listed below, or by using the keyword search tool below to find specific information within the annual report.-
 1
1 -
 2
2 -
 3
3 -
 4
4 -
 5
5 -
 6
6 -
 7
7 -
 8
8 -
 9
9 -
 10
10 -
 11
11 -
 12
12 -
 13
13 -
 14
14 -
15
-
16
-
17
-
18
-
19
-
20
-
21
-
22
-
23
-
24
-
25
-
26
-
27
-
28
-
29
-
30
-
31
-
32
-
33
-
34
-
35
-
36
 |
 |

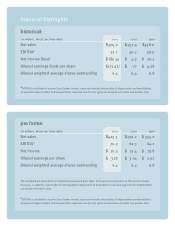
financial highlights
historical:
(in millions, except per share data) 2001 2000 1999
Net sales $305.0 $357.4 $358.0
EBITDA* 32.7 40.7 58.5
Net income (loss) $ (85.4) $ 4.9 $ 29.2
Diluted earnings (loss) per share $(13.43) $ .77 $ 4.28
Diluted weighted average shares outstanding 6.4 6.4 6.8
pro forma:
(in millions, except per share data) 2001 2000 1999
Net sales $425.5 $390.2 $ 355.0
EBITDA* 70.3 62.3 64.2
Net income $ 20.3 $ 19.4 $ 19.8
Diluted earnings per share $ 3.18 $ 3.04 $ 2.92
Diluted weighted average shares outstanding 6.4 6.4 6.8
The unaudited pro forma financial information presented gives effect to the planned acquisition of Tilia and the related
financing. In addition, it gives effect to the significant dispositions of businesses in 2001 and 1999 and the related federal
tax refunds received in 2002.
*EBITDA is calculated as income (loss) before interest, taxes and minority interest plus (i) depreciation and amortization,
(ii) special charges (credits) and reorganization expenses and (iii) loss (gain) on divestiture of assets and product lines.
*EBITDA is calculated as income (loss) before interest, taxes and minority interest plus (i) depreciation and amortization,
(ii) special charges (credits) and reorganization expenses and (iii) loss (gain) on divestiture of assets and product lines.