Starwood 2006 Annual Report Download - page 36
Download and view the complete annual report
Please find page 36 of the 2006 Starwood annual report below. You can navigate through the pages in the report by either clicking on the pages listed below, or by using the keyword search tool below to find specific information within the annual report.-
 1
1 -
2
-
3
-
4
-
5
-
6
-
7
-
8
-
9
-
10
-
11
-
12
-
13
-
14
-
15
-
16
-
17
-
18
-
19
-
20
-
21
-
22
-
23
-
24
-
25
-
 26
26 -
 27
27 -
 28
28 -
 29
29 -
 30
30 -
 31
31 -
 32
32 -
 33
33 -
 34
34 -
 35
35 -
 36
36 -
 37
37 -
 38
38 -
 39
39 -
 40
40 -
 41
41 -
 42
42 -
 43
43 -
 44
44 -
 45
45 -
 46
46 -
47
-
48
-
49
-
50
-
51
-
52
-
53
-
54
-
55
-
56
-
57
-
58
-
59
-
60
-
61
-
62
-
63
-
64
-
65
-
66
-
67
-
68
-
69
-
70
-
71
-
72
-
73
-
74
-
75
-
76
-
77
-
78
-
79
-
80
-
81
-
82
-
83
-
84
-
85
-
86
-
87
-
88
-
89
-
90
-
91
-
92
-
93
-
94
-
95
-
96
-
97
-
98
-
99
-
100
-
101
-
102
-
103
-
104
-
105
-
106
-
107
-
108
-
109
-
110
-
111
-
112
-
113
-
114
-
115
 |
 |
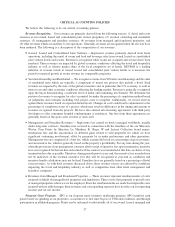
RESULTS OF OPERATIONS
The following discussion presents an analysis of results of our operations for the years ended December 31,
2006, 2005 and 2004.
Year Ended December 31, 2006 Compared with Year Ended December 31, 2005
Continuing Operations
Revenues. Total revenues, including other revenues from managed and franchised properties, were
$5.979 billion, an increase of $2 million when compared to 2005 levels. Revenues reflected a 23.5% decrease
in revenues from our owned, leased and consolidated joint venture hotels to $2.692 billion for the year ended
December 31, 2006 when compared to $3.517 billion in the corresponding period of 2005, a 39.1% increase in
management fees, franchise fees and other income to $697 million for the year ended December 31, 2006 when
compared to $501 million in the corresponding period of 2005, a 13.0% increase in vacation ownership and
residential revenues to $1.005 billion for the year ended December 31, 2006 when compared to $889 million in the
corresponding period of 2005, and an increase of $515 million in other revenues from managed and franchised
properties to $1.585 billion for the year ended December 31, 2006 when compared to $1.070 billion in the
corresponding period of 2005.
The decrease in revenues from owned, leased and consolidated joint venture hotels of $825 million was
primarily due to lost revenues from 45 wholly owned hotels sold or closed during 2006. These hotels had revenues
of $384 million in the year ended December 31, 2006 compared to $1.299 billion in the corresponding period of
2005. The decrease in revenues from sold hotels was partially offset by business interruption insurance proceeds
received in 2006 of approximately $33 million, primarily related to Hurricane Katrina and Hurricane Wilma in
2005, and by improved results at our remaining owned, leased and consolidated joint venture hotels. Revenues at
our Same-Store Owned Hotels (74 hotels for the years ended December 31, 2006 and 2005, excluding 56 hotels sold
or closed and 11 hotels undergoing significant repositionings or without comparable results in 2006 and
2005) increased 8.8%, or $157 million, to $1.942 billion for the year ended December 31, 2006 when compared
to $1.785 billion in the same period of 2005 due primarily to an increase in REVPAR. REVPAR at our Same-Store
Owned Hotels increased 10.1% to $136.33 for the year ended December 31, 2006 when compared to the
corresponding 2005 period. The increase in REVPAR at these Same-Store Owned Hotels was attributed to
increases in occupancy rates to 71.2% in the year ended December 31, 2006 when compared to 69.9% in the same
period in 2005, and an 8.2% increase in ADR to $191.56 for the year ended December 31, 2006 compared to
$177.04 for the corresponding 2005 period. REVPAR at Same-Store Owned Hotels in North America increased
10.2% for the year ended December 31, 2006 when compared to the same period of 2005. REVPAR growth was
particularly strong at our owned hotels in Chicago, Illinois, Boston, Massachusetts, and Seattle, Washington.
REVPAR at our international Same-Store Owned Hotels increased by 10.0% for the year ended December 31, 2006
when compared to the same period of 2005. REVPAR for Same-Store Owned Hotels internationally increased 9.5%
excluding the favorable effects of foreign currency translation.
The increase in management fees, franchise fees and other income of $196 million was primarily a result of a
$202 million increase in management and franchise revenue to $564 million for the year ended December 31, 2006
due to the addition of new managed and franchised hotels. The increase included approximately $44 million of
management and franchise fees from the 33 hotels sold to Host, as well as approximately $34 million of revenues
from the amortization of the deferred gain associated with the Host Transaction. The increase was also due to
$58 million of management and franchise fees from the Le Méridien hotels in 2006 as compared to $5 million in
2005. We acquired the Le Méridien brand and related management and franchise business in November 2005 (the
“Le Méridien Acquisition”). Additionally, improved operating results at the underlying managed and franchised
hotels, increased revenue from our Bliss spas and from the sale of Bliss products and income associated with the
settlement of a dispute related to an agreement to manage a hotel contributed to the increase in 2006. These
increases were partially offset by lost fees from contracts that were terminated in the last 12 months and by lost
income on the Le Méridien debt participation which was used to fund a portion of the Le Méridien Acquisition.
The increase in vacation ownership and residential sales and services of $116 million was primarily due to
increased sales at ongoing projects in Hawaii and Orlando as well as sales of $41 million at a new project in New
29