Southwest Airlines 2011 Annual Report Download - page 8
Download and view the complete annual report
Please find page 8 of the 2011 Southwest Airlines annual report below. You can navigate through the pages in the report by either clicking on the pages listed below, or by using the keyword search tool below to find specific information within the annual report.-
 1
1 -
 2
2 -
 3
3 -
 4
4 -
 5
5 -
 6
6 -
 7
7 -
 8
8 -
 9
9 -
 10
10 -
 11
11 -
 12
12 -
 13
13 -
 14
14 -
 15
15 -
 16
16 -
 17
17 -
 18
18 -
 19
19 -
20
-
21
-
22
-
23
-
24
-
25
-
26
-
27
-
28
-
29
-
30
-
31
-
32
-
33
-
34
-
35
-
36
-
37
-
38
-
39
-
40
-
41
-
42
-
43
-
44
-
45
-
46
-
47
-
48
-
49
-
50
-
51
-
52
-
53
-
54
-
55
-
56
-
57
-
58
-
59
-
60
-
61
-
62
-
63
-
64
-
65
-
66
-
67
-
68
-
69
-
70
-
71
-
72
-
73
-
74
-
75
-
76
-
77
-
78
-
79
-
80
-
81
-
82
-
83
-
84
-
85
-
86
-
87
-
88
-
89
-
90
-
91
-
92
-
93
-
94
-
95
-
96
-
97
-
98
-
99
-
100
-
101
-
102
-
103
-
104
-
105
-
106
-
107
-
108
-
109
-
110
-
111
-
112
-
113
-
114
-
115
-
116
-
117
-
118
-
119
-
120
-
121
-
122
-
123
-
124
-
125
-
126
-
127
-
128
-
129
-
130
-
131
-
132
-
133
-
134
-
135
-
136
-
137
-
138
-
139
-
140
-
141
 |
 |
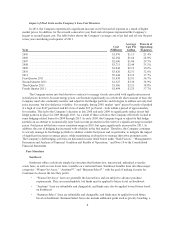
susceptible to detrimental events such as acts of terrorism, poor weather, and natural disasters. Over the last
decade, total financial losses for the U.S. airline industry have exceeded $50 billion. These losses were driven by
factors such as 9/11, the worst economic recession in aviation history, and a worldwide credit crisis. In addition,
in recent years the industry has been particularly negatively affected by high and volatile fuel prices. These
factors have contributed to volatile and unpredictable demand for air travel and related cost and pricing
challenges. Fuel costs alone have risen over 300 percent from 2000 levels. As a result, several U.S. airlines have
ceased operations or reorganized through bankruptcy.
The U.S. economy has experienced a moderate recovery since emerging from recession in 2009; however,
economic uncertainty continued to impact the airline industry in 2011, which resulted in continued industry
restraint with respect to overall capacity (number of available seats). Although some air carriers, including
Southwest, experienced modest year-over-year increases in capacity during most of 201l, overall domestic airline
industry capacity remained below pre-recession levels. The leaner flight schedules have led to improvements in
industry load factors (percentage of seats filled by fare-paying passengers) and yields (revenue production per
passenger mile).
Company Operations
Route Structure
General
Southwest principally provides point-to-point service, rather than the “hub-and-spoke” service provided by
most major U.S. airlines (often referred to as “legacy” or “network” airlines). The hub-and-spoke system
concentrates most of an airline’s operations at a limited number of central hub cities and serves most other
destinations in the system by providing one-stop or connecting service through a hub. Any issue at a hub, such as
bad weather or a security problem, can create delays throughout the system. By not concentrating operations
through one or more central transfer points, Southwest’s point-to-point route structure has allowed for more
direct non-stop routing than hub-and-spoke service. This in turn has historically enabled Southwest to control
delays and total trip time. For 2011, approximately 71 percent of Southwest’s Customers flew non-stop, and
Southwest’s average aircraft trip stage length was 664 miles with an average duration of approximately 1.8
hours. For 2010, approximately 73 percent of Southwest’s Customers flew non-stop, and Southwest’s average
aircraft trip stage length was 648 miles with an average duration of approximately 1.8 hours. The 2011 decrease
in percentage of non-stop Customers reflects, in part, the Company’s network optimization efforts, which have
included publishing more itineraries with enhanced connecting opportunities and which have also contributed to
improved load factors. The Company’s network optimization is discussed in more detail below under “Operating
Strategies and Initiatives – Network Optimization and Revenue Management.”
Southwest’s point-to-point service has also enabled it to provide its markets with frequent, conveniently
timed flights and low fares. For example, Southwest currently offers 25 weekday roundtrips from Dallas Love
Field to Houston Hobby, 13 weekday roundtrips from Phoenix to Las Vegas, 13 weekday roundtrips from
Burbank to Oakland, and 12 weekday roundtrips from Los Angeles International to Oakland. Southwest
complements these high-frequency short-haul routes with long-haul non-stop service between markets such as
Los Angeles and Nashville, Las Vegas and Orlando, and San Diego and Baltimore. As of December 31, 2011,
Southwest served 479 non-stop city pairs.
Unlike Southwest, AirTran currently operates largely through a hub-and-spoke network system, with
approximately half of its flights originating or terminating at its largest hub at Hartsfield-Jackson Atlanta
International Airport. AirTran also serves a number of markets with non-stop service from smaller bases of
operation in Baltimore, Maryland; Milwaukee, Wisconsin; and Orlando, Florida.
International Service
Southwest does not currently provide international service; however, Southwest Customers are able to
book international flights with connecting service by Volaris, Mexico’s second largest airline. Southwest offers
2