Sony 2012 Annual Report Download - page 33
Download and view the complete annual report
Please find page 33 of the 2012 Sony annual report below. You can navigate through the pages in the report by either clicking on the pages listed below, or by using the keyword search tool below to find specific information within the annual report.-
 1
1 -
2
-
3
-
4
-
5
-
6
-
7
-
8
-
9
-
10
-
11
-
12
-
13
-
14
-
15
-
16
-
17
-
18
-
19
-
20
-
21
-
22
-
 23
23 -
 24
24 -
 25
25 -
 26
26 -
 27
27 -
 28
28 -
 29
29 -
 30
30 -
 31
31 -
 32
32 -
 33
33 -
 34
34 -
 35
35 -
 36
36 -
 37
37 -
 38
38 -
 39
39 -
 40
40 -
 41
41 -
 42
42 -
 43
43 -
44
-
45
-
46
-
47
-
48
-
49
-
50
-
51
-
52
-
53
-
54
-
55
-
56
-
57
-
58
-
59
-
60
-
61
-
62
-
63
-
64
-
65
-
66
-
67
-
68
-
69
-
70
-
71
-
72
 |
 |

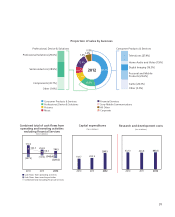
Capital expenditures
(Yen in billions)
295.1
204.9
192.7
2010 2011 2012
Cash flows from operating activities
Cash flows from investing activities
Combined total excluding Financial Services
Combined total of cash flows from
operating and investing activities
excluding Financial Services
(Yen in billions)
255.8
(137.6)
176.1
(321.5)
118.3
(145.4)
570.2
(247.9)
322.3
2010 2011 2012
Research and development costs
(Yen in billions)
432.0 433.5
426.8
2010 2011 2012
Proportion of sales by business
Home Audio and Video (7.9%)
Professional, Device & Solutions Consumer Products & Services
Digital Imaging (16.3%)
Televisions (27.4%)
Professional Solutions (29.0%)
Semiconductors (38.9%)
Components (30.7%)
Other (1.4%)
Personal and Mobile
Products (23.6%)
Game (24.3%)
Other (0.5%)
10.1%
47.2%
14.9%
6.6%
13.4%
5.8%
1.2%
0.8%
2012
Consumer Products & Services
Professional, Device & Solutions
Pictures
Music
Financial Services
Sony Mobile Communications
All Other
Corporate
31