Sonic 2005 Annual Report Download - page 2
Download and view the complete annual report
Please find page 2 of the 2005 Sonic annual report below. You can navigate through the pages in the report by either clicking on the pages listed below, or by using the keyword search tool below to find specific information within the annual report.-
 1
1 -
 2
2 -
 3
3 -
 4
4 -
 5
5 -
 6
6 -
 7
7 -
 8
8 -
 9
9 -
 10
10 -
 11
11 -
 12
12 -
 13
13 -
14
-
15
-
16
-
17
-
18
-
19
-
20
-
21
-
22
-
23
-
24
-
25
-
26
-
27
-
28
-
29
-
30
-
31
-
32
-
33
-
34
-
35
-
36
-
37
-
38
-
39
-
40
-
41
-
42
-
43
-
44
-
45
-
46
-
47
-
48
-
49
-
50
-
51
-
52
-
53
-
54
-
55
-
56
 |
 |

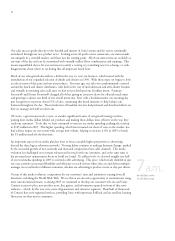
6.0
3,000 20
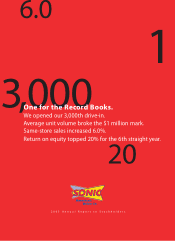
Sonic began in 1953 in Shawnee, Oklahoma. Today, we
franchise and operate the largest chain of drive-in
restaurants in the country, with more than 3,000 Sonic
Drive-Ins from coast to coast and in northern Mexico.
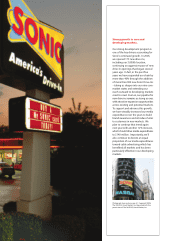
Our drive-in restaurant experience, together with
a unique menu and personalized carhop service,
position us as one of the most highly differentiated
concepts in the quick-service restaurant industry (QSR).
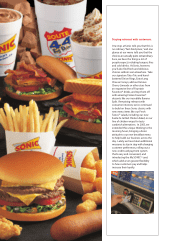
Sonic Drive-Ins feature signature items, offering
made-when-you-order hamburgers, Extra-Long
Cheese Coneys, wraps, and other sandwiches, hand-
battered Onion Rings,Tater Tots, and a variety of
Frozen Favorites® desserts and Fountain Favorites®
drinks, including Cherry Limeades, Slushes and Cream
Pie Shakes. Sonic also offers a variety of choices for
health-conscious customers, including Fresh Tastes™
salads and several low-calorie drinks, including a diet
version of our classic Cherry Limeade.
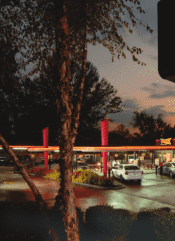
At a typical Sonic Drive-In, customers park in one
of 24 to 36 canopy-covered spaces and place orders
through an intercom speaker system. A carhop
delivers the customer’s order curbside, usually within
four minutes. Customers also may stop at a drive-thru
window at most Sonics.
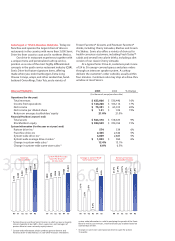
00 01 02 03 04 05
Drive-Ins
System-Wide2
2,885
2,706
2,533
2,359
2,175
3,039
00 01 02 03 04 05
$964
$907
$906
$874
$853
00 01 02 03 04 05
Change in System-Wide
Same-Store Sales2,3
0.3%
3.5%
2.3%
3.7%
6.0%
00 01 02 03 04 05
Return on Average
Stockholders’ Equity
21.0%
21.1%
22.1%
21.9%
21.4%
21.0%
System-Wide Average
Sales Per Drive-In2
(in thousands)
$1,023
Financial Highlights 2005 2004 % Change
($ in thousands, except per share data)
Operations (for the year)
Total revenues $ 623,066 $ 536,446 16%
Income from operations $124,206 $ 106,114 17%
Net income $75,381 $63,015 20%
Net income per diluted share $ 1.21 $ 1.02 19%
Return on average stockholders’ equity 21.0% 21.0%
Financial Position (at year’s end)
Total assets $563,316 $518,633 9%
Stockholders’ equity $ 384,539 $ 334,762 15%
System Information (for the year or at year’s end)
Partner drive-ins 1574 539 6%
Franchise drive-ins 2,465 2,346 5%
System-wide drive-ins 23,039 2,885 5%
System-wide average drive-in sales 2$ 1,023 $ 964 6%
Change in system-wide sales 212.4% 13.1%
Change in system-wide same-store sales 2,3 6.0% 6.5%
1Partner drive-ins are those Sonic Drive-Ins in which we own a majority
interest, typically at least 60%. Most supervisors and managers of
partner drive-ins own a minority equity interest.
2System-wide information, which combines partner drive-in and
franchise drive-in information, is a non-GAAP measure. We believe
system-wide information is useful in analyzing the growth of the Sonic
brand as well as our revenues, since franchisees pay royalties based on
a percentage of sales.
3Changes in same-store sales based on drive-ins open for at least
15 months.
6.5%
1