Sallie Mae 2015 Annual Report Download - page 119
Download and view the complete annual report
Please find page 119 of the 2015 Sallie Mae annual report below. You can navigate through the pages in the report by either clicking on the pages listed below, or by using the keyword search tool below to find specific information within the annual report.-
 1
1 -
2
-
3
-
4
-
5
-
6
-
7
-
8
-
9
-
10
-
11
-
12
-
13
-
14
-
15
-
16
-
17
-
18
-
19
-
20
-
21
-
22
-
23
-
24
-
25
-
26
-
27
-
28
-
29
-
30
-
31
-
32
-
33
-
34
-
35
-
36
-
37
-
38
-
39
-
40
-
41
-
42
-
43
-
44
-
45
-
46
-
47
-
48
-
49
-
50
-
51
-
52
-
53
-
54
-
55
-
56
-
57
-
58
-
59
-
60
-
61
-
62
-
63
-
64
-
65
-
66
-
67
-
68
-
69
-
70
-
71
-
72
-
73
-
74
-
75
-
76
-
77
-
78
-
79
-
80
-
81
-
82
-
83
-
84
-
85
-
86
-
87
-
88
-
89
-
90
-
91
-
92
-
93
-
94
-
95
-
96
-
97
-
98
-
99
-
100
-
101
-
102
-
103
-
104
-
105
-
106
-
107
-
108
-
 109
109 -
 110
110 -
 111
111 -
 112
112 -
 113
113 -
 114
114 -
 115
115 -
 116
116 -
 117
117 -
 118
118 -
 119
119 -
 120
120 -
 121
121 -
 122
122 -
 123
123 -
 124
124 -
 125
125 -
 126
126 -
 127
127 -
 128
128 -
 129
129 -
130
-
131
-
132
-
133
-
134
-
135
-
136
-
137
-
138
-
139
-
140
-
141
-
142
-
143
-
144
-
145
-
146
-
147
-
148
-
149
-
150
-
151
-
152
-
153
-
154
-
155
-
156
-
157
-
158
-
159
-
160
-
161
-
162
-
163
-
164
-
165
-
166
-
167
-
168
-
169
-
170
-
171
-
172
-
173
-
174
-
175
-
176
-
177
-
178
-
179
-
180
-
181
-
182
-
183
-
184
-
185
-
186
-
187
-
188
-
189
-
190
-
191
-
192
-
193
-
194
-
195
-
196
-
197
-
198
-
199
-
200
-
201
-
202
-
203
-
204
-
205
-
206
-
207
-
208
-
209
-
210
-
211
-
212
-
213
-
214
-
215
-
216
-
217
-
218
-
219
-
220
-
221
-
222
-
223
-
224
-
225
-
226
-
227
-
228
-
229
-
230
-
231
-
232
-
233
-
234
-
235
-
236
-
237
-
238
-
239
-
240
-
241
-
242
-
243
-
244
-
245
-
246
-
247
-
248
-
249
-
250
-
251
-
252
-
253
-
254
-
255
-
256
-
257
 |
 |

SLM CORPORATION
NOTES TO CONSOLIDATED FINANCIAL STATEMENTS (Continued)
(Dollars in thousands, unless otherwise noted)
F-29
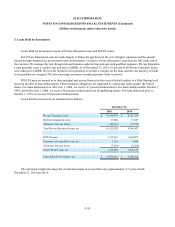
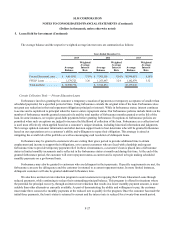
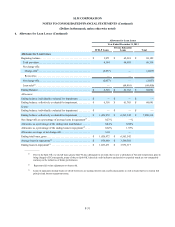
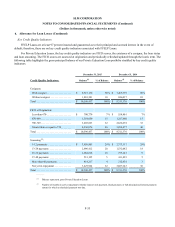
6. Allowance for Loan Losses
Our provision for credit losses represents the periodic expense of maintaining an allowance sufficient to absorb incurred
probable losses in the held-for-investment loan portfolios. The evaluation of the allowance for loan losses is inherently
subjective, as it requires material estimates that may be susceptible to significant changes. We believe the allowance for loan
losses is appropriate to cover probable losses incurred in the loan portfolios. See Note 2, “Significant Accounting Policies —
Allowance for Private Education Loan Losses and — Allowance for FFELP Loan Losses” for a more detailed discussion.
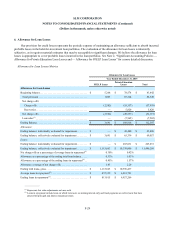
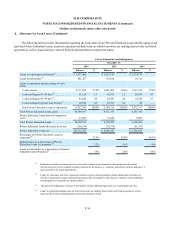
Allowance for Loan Losses Metrics
Allowance for Loan Losses
Year Ended December 31, 2015
FFELP Loans Private Education
Loans Total
Allowance for Loan Losses
Beginning balance. . . . . . . . . . . . . . . . . . . . . . . . . . . . . . . . . . . . . $ 5,268 $ 78,574 $ 83,842
Total provision . . . . . . . . . . . . . . . . . . . . . . . . . . . . . . . . . . . . . . 1,005 87,344 88,349
Net charge-offs:
Charge-offs . . . . . . . . . . . . . . . . . . . . . . . . . . . . . . . . . . . . . . . (2,582) (55,357) (57,939)
Recoveries . . . . . . . . . . . . . . . . . . . . . . . . . . . . . . . . . . . . . . . . — 5,820 5,820
Net charge-offs. . . . . . . . . . . . . . . . . . . . . . . . . . . . . . . . . . . . . . (2,582) (49,537) (52,119)
Loan sales(1) . . . . . . . . . . . . . . . . . . . . . . . . . . . . . . . . . . . . . . . . — (7,565) (7,565)
Ending Balance . . . . . . . . . . . . . . . . . . . . . . . . . . . . . . . . . . . . . . . $ 3,691 $ 108,816 $ 112,507
Allowance:
Ending balance: individually evaluated for impairment. . . . . . . . $ — $ 43,480 $ 43,480
Ending balance: collectively evaluated for impairment . . . . . . . . $ 3,691 $ 65,336 $ 69,027
Loans:
Ending balance: individually evaluated for impairment. . . . . . . . $ — $ 265,831 $ 265,831
Ending balance: collectively evaluated for impairment . . . . . . . . $ 1,115,663 $ 10,330,606 $ 11,446,269
Net charge-offs as a percentage of average loans in repayment(2) 0.30% 0.82%
Allowance as a percentage of the ending total loan balance. . . . . 0.33% 1.03%
Allowance as a percentage of the ending loans in repayment(2) . . 0.45% 1.57%
Allowance coverage of net charge-offs. . . . . . . . . . . . . . . . . . . . . 1.43 2.20
Ending total loans, gross. . . . . . . . . . . . . . . . . . . . . . . . . . . . . . . . $ 1,115,663 $ 10,596,437
Average loans in repayment(2). . . . . . . . . . . . . . . . . . . . . . . . . . . . $ 857,359 $ 6,031,741
Ending loans in repayment(2). . . . . . . . . . . . . . . . . . . . . . . . . . . . . $ 813,815 $ 6,927,266
____________
(1) Represents fair value adjustments on loans sold.
(2) Loans in repayment include loans on which borrowers are making interest only and fixed payments as well as loans that have
entered full principal and interest repayment status.