Sallie Mae 2013 Annual Report Download - page 89
Download and view the complete annual report
Please find page 89 of the 2013 Sallie Mae annual report below. You can navigate through the pages in the report by either clicking on the pages listed below, or by using the keyword search tool below to find specific information within the annual report.-
 1
1 -
2
-
3
-
4
-
5
-
6
-
7
-
8
-
9
-
10
-
11
-
12
-
13
-
14
-
15
-
16
-
17
-
18
-
19
-
20
-
21
-
22
-
23
-
24
-
25
-
26
-
27
-
28
-
29
-
30
-
31
-
32
-
33
-
34
-
35
-
36
-
37
-
38
-
39
-
40
-
41
-
42
-
43
-
44
-
45
-
46
-
47
-
48
-
49
-
50
-
51
-
52
-
53
-
54
-
55
-
56
-
57
-
58
-
59
-
60
-
61
-
62
-
63
-
64
-
65
-
66
-
67
-
68
-
69
-
70
-
71
-
72
-
73
-
74
-
75
-
76
-
77
-
78
-
 79
79 -
 80
80 -
 81
81 -
 82
82 -
 83
83 -
 84
84 -
 85
85 -
 86
86 -
 87
87 -
 88
88 -
 89
89 -
 90
90 -
 91
91 -
 92
92 -
 93
93 -
 94
94 -
 95
95 -
 96
96 -
 97
97 -
 98
98 -
 99
99 -
100
-
101
-
102
-
103
-
104
-
105
-
106
-
107
-
108
-
109
-
110
-
111
-
112
-
113
-
114
-
115
-
116
-
117
-
118
-
119
-
120
-
121
-
122
-
123
-
124
-
125
-
126
-
127
-
128
-
129
-
130
-
131
-
132
-
133
-
134
-
135
-
136
-
137
-
138
-
139
-
140
-
141
-
142
-
143
-
144
-
145
-
146
-
147
-
148
-
149
-
150
-
151
-
152
-
153
-
154
-
155
-
156
-
157
-
158
-
159
-
160
-
161
-
162
-
163
-
164
-
165
-
166
-
167
-
168
-
169
-
170
-
171
-
172
-
173
-
174
-
175
-
176
-
177
-
178
-
179
-
180
-
181
-
182
-
183
-
184
-
185
-
186
-
187
-
188
-
189
-
190
-
191
-
192
-
193
-
194
-
195
-
196
-
197
-
198
-
199
-
200
-
201
-
202
-
203
-
204
-
205
-
206
-
207
-
208
-
209
-
210
-
211
-
212
-
213
-
214
-
215
-
216
-
217
-
218
-
219
-
220
-
221
-
222
-
223
-
224
-
225
-
226
-
227
-
228
-
229
-
230
-
231
-
232
 |
 |

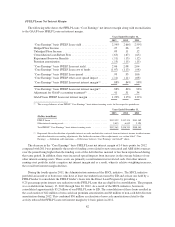
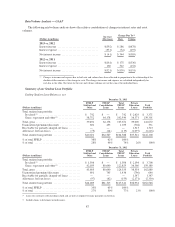
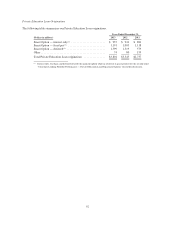
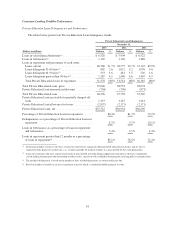
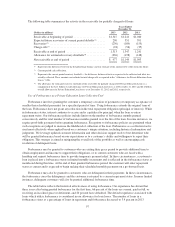
Rate/Volume Analysis — GAAP
The following rate/volume analysis shows the relative contribution of changes in interest rates and asset
volumes.
Increase
(Decrease)
Change Due To(1)
(Dollars in millions) Rate Volume
2013 vs. 2012
Interest income .............................. $(392) $ 286 $(678)
Interest expense .............................. (351) (54) (297)
Net interest income ........................... $ (41) $ 344 $(385)
2012 vs. 2011
Interest income .............................. $(161) $ 175 $(336)
Interest expense .............................. 160 312 (152)
Net interest income ........................... $(321) $(130) $(191)
(1) Changes in income and expense due to both rate and volume have been allocated in proportion to the relationship of the
absolute dollar amounts of the change in each. The changes in income and expense are calculated independently for
each line in the table. The totals for the rate and volume columns are not the sum of the individual lines.
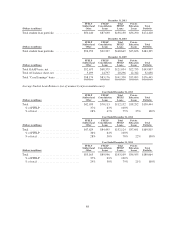
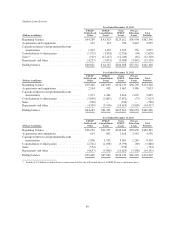
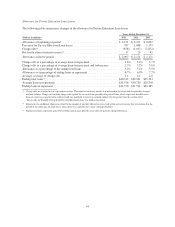
Summary of our Student Loan Portfolio
Ending Student Loan Balances, net
December 31, 2013
(Dollars in millions)
FFELP
Stafford and
Other
FFELP
Consolidation
Loans
Total
FFELP
Loans
Private
Education
Loans
Total
Portfolio
Total student loan portfolio:
In-school(1) ............................... $ 742 $ — $ 742 $ 2,629 $ 3,371
Grace, repayment and other(2) ................ 38,752 64,178 102,930 36,371 139,301
Total, gross ................................. 39,494 64,178 103,672 39,000 142,672
Unamortized premium/(discount) ............... 602 433 1,035 (704) 331
Receivable for partially charged-off loans ......... — — — 1,313 1,313
Allowance for loan losses ..................... (75) (44) (119) (2,097) (2,216)
Total student loan portfolio .................... $40,021 $64,567 $104,588 $37,512 $142,100
% of total FFELP ............................ 38% 62% 100%
% of total .................................. 28% 46% 74% 26% 100%
December 31, 2012
(Dollars in millions)
FFELP
Stafford and
Other
FFELP
Consolidation
Loans
Total
FFELP
Loans
Private
Education
Loans
Total
Portfolio
Total student loan portfolio:
In-school(1) ............................... $ 1,506 $ — $ 1,506 $ 2,194 $ 3,700
Grace, repayment and other(2) ................ 42,189 80,640 122,829 36,360 159,189
Total, gross ................................. 43,695 80,640 124,335 38,554 162,889
Unamortized premium/(discount) ............... 691 745 1,436 (796) 640
Receivable for partially charged-off loans ......... — — — 1,347 1,347
Allowance for loan losses ..................... (97) (62) (159) (2,171) (2,330)
Total student loan portfolio .................... $44,289 $81,323 $125,612 $36,934 $162,546
% of total FFELP ............................ 35% 65% 100%
% of total .................................. 27% 50% 77% 23% 100%
(1) Loans for customers still attending school and are not yet required to make payments on the loan.
(2) Includes loans in deferment or forbearance.
87