Sallie Mae 2012 Annual Report Download - page 59
Download and view the complete annual report
Please find page 59 of the 2012 Sallie Mae annual report below. You can navigate through the pages in the report by either clicking on the pages listed below, or by using the keyword search tool below to find specific information within the annual report.-
 1
1 -
2
-
3
-
4
-
5
-
6
-
7
-
8
-
9
-
10
-
11
-
12
-
13
-
14
-
15
-
16
-
17
-
18
-
19
-
20
-
21
-
22
-
23
-
24
-
25
-
26
-
27
-
28
-
29
-
30
-
31
-
32
-
33
-
34
-
35
-
36
-
37
-
38
-
39
-
40
-
41
-
42
-
43
-
44
-
45
-
46
-
47
-
48
-
 49
49 -
 50
50 -
 51
51 -
 52
52 -
 53
53 -
 54
54 -
 55
55 -
 56
56 -
 57
57 -
 58
58 -
 59
59 -
 60
60 -
 61
61 -
 62
62 -
 63
63 -
 64
64 -
 65
65 -
 66
66 -
 67
67 -
 68
68 -
 69
69 -
70
-
71
-
72
-
73
-
74
-
75
-
76
-
77
-
78
-
79
-
80
-
81
-
82
-
83
-
84
-
85
-
86
-
87
-
88
-
89
-
90
-
91
-
92
-
93
-
94
-
95
-
96
-
97
-
98
-
99
-
100
-
101
-
102
-
103
-
104
-
105
-
106
-
107
-
108
-
109
-
110
-
111
-
112
-
113
-
114
-
115
-
116
-
117
-
118
-
119
-
120
-
121
-
122
-
123
-
124
-
125
-
126
-
127
-
128
-
129
-
130
-
131
-
132
-
133
-
134
-
135
-
136
-
137
-
138
-
139
-
140
-
141
-
142
-
143
-
144
-
145
-
146
-
147
-
148
-
149
-
150
-
151
-
152
-
153
-
154
-
155
-
156
-
157
-
158
-
159
-
160
-
161
-
162
-
163
-
164
-
165
-
166
-
167
-
168
-
169
-
170
-
171
-
172
-
173
-
174
-
175
-
176
-
177
-
178
-
179
-
180
-
181
-
182
-
183
-
184
-
185
-
186
-
187
-
188
-
189
-
190
-
191
-
192
-
193
-
194
-
195
-
196
-
197
-
198
-
199
-
200
-
201
-
202
-
203
-
204
-
205
-
206
-
207
 |
 |

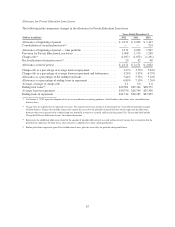
above. Overhead expenses include costs related to executive management, the board of directors, accounting,
finance, legal, human resources, stock-based compensation expense and certain information technology costs
related to infrastructure and operations.
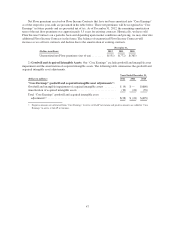
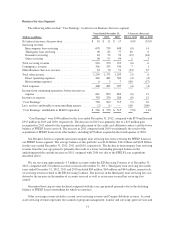
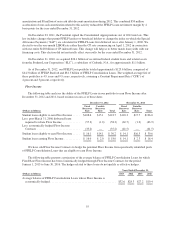
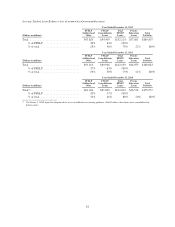
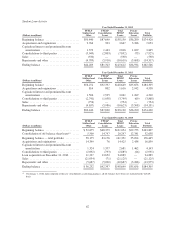
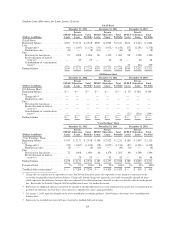
The following table includes “Core Earnings” results for our Other segment.
Years Ended
December 31, % Increase (Decrease)
(Dollars in millions) 2012 2011 2010 2012 vs. 2011 2011 vs. 2010
Net interest loss after provision ........................ $ (19) $ (58) $ (35) (67)% 66%
Gains on debt repurchases ........................ 145 64 317 127 (80)
Other ......................................... 15 (8) 14 288 (157)
Total income ....................................... 160 56 331 186 (83)
Direct operating expenses ............................. 7 13 12 (46) 8
Overhead expenses:
Corporate overhead ............................. 121 163 128 (26) 27
Unallocated information technology costs ............ 109 117 130 (7) (10)
Total overhead expenses .............................. 230 280 258 (18) 9
Total operating expenses ............................. 237 293 270 (19) 9
Restructuring expenses ............................... 4 2 12 100 (83)
Total expenses ..................................... 241 295 282 (18) 5
Income (loss) from continuing operations, before income tax
expense (benefit) ................................. (100) (297) 14 (66) (2,221)
Income tax expense (benefit) .......................... (36) (109) 4 (67) (2,825)
Net income (loss) from continuing operations ............. (64) (188) 10 (66) (1,980)
Income (loss) from discontinued operations, net of tax
expense (benefit) ................................. 1 33 (67) (97) 149
“Core Earnings” net loss ............................. $ (63) $(155) $ (57) (59)% 172%
Net Interest Income (Loss) after Provision for Loan Losses
Net interest income (loss) after provision for loan losses includes net interest income related to our corporate
liquidity portfolio as well as net interest income and provision expense related to our mortgage and consumer
loan portfolios. The improvement compared with the prior-year periods was primarily the result of our not
recording any provision for loan losses related to our mortgage and consumer loan portfolios in 2012. Each
quarter we perform an analysis regarding the adequacy of the loan loss allowance for these portfolios and we
determined that no additional allowance for loan losses was required related to this $137 million portfolio.
Gains on Debt Repurchases
We repurchased $711 million, $894 million and $4.9 billion face amount of our ABS and senior unsecured
notes in 2012, 2011 and 2010, respectively.
Other Income
The year ended December 31, 2011 includes $26 million of impairment on certain investments in aircraft
leveraged leases. As of December 31, 2012, our total remaining investment in airline leases is $39 million.
Purchased Paper Business
Our Purchased Paper businesses are presented as discontinued operations for the current and prior periods
(see “Consolidated Earnings Summary — GAAP-basis” for a further discussion). We sold our Purchased
Paper — Non-Mortgage business, resulting in a $23 million after-tax gain, in 2011.
57