Sallie Mae 2010 Annual Report Download - page 59
Download and view the complete annual report
Please find page 59 of the 2010 Sallie Mae annual report below. You can navigate through the pages in the report by either clicking on the pages listed below, or by using the keyword search tool below to find specific information within the annual report.-
 1
1 -
2
-
3
-
4
-
5
-
6
-
7
-
8
-
9
-
10
-
11
-
12
-
13
-
14
-
15
-
16
-
17
-
18
-
19
-
20
-
21
-
22
-
23
-
24
-
25
-
26
-
27
-
28
-
29
-
30
-
31
-
32
-
33
-
34
-
35
-
36
-
37
-
38
-
39
-
40
-
41
-
42
-
43
-
44
-
45
-
46
-
47
-
48
-
 49
49 -
 50
50 -
 51
51 -
 52
52 -
 53
53 -
 54
54 -
 55
55 -
 56
56 -
 57
57 -
 58
58 -
 59
59 -
 60
60 -
 61
61 -
 62
62 -
 63
63 -
 64
64 -
 65
65 -
 66
66 -
 67
67 -
 68
68 -
 69
69 -
70
-
71
-
72
-
73
-
74
-
75
-
76
-
77
-
78
-
79
-
80
-
81
-
82
-
83
-
84
-
85
-
86
-
87
-
88
-
89
-
90
-
91
-
92
-
93
-
94
-
95
-
96
-
97
-
98
-
99
-
100
-
101
-
102
-
103
-
104
-
105
-
106
-
107
-
108
-
109
-
110
-
111
-
112
-
113
-
114
-
115
-
116
-
117
-
118
-
119
-
120
-
121
-
122
-
123
-
124
-
125
-
126
-
127
-
128
-
129
-
130
-
131
-
132
-
133
-
134
-
135
-
136
-
137
-
138
-
139
-
140
-
141
-
142
-
143
-
144
-
145
-
146
-
147
-
148
-
149
-
150
-
151
-
152
-
153
-
154
-
155
-
156
-
157
-
158
-
159
-
160
-
161
-
162
-
163
-
164
-
165
-
166
-
167
-
168
-
169
-
170
-
171
-
172
-
173
-
174
-
175
-
176
-
177
-
178
-
179
-
180
-
181
-
182
-
183
-
184
-
185
-
186
-
187
-
188
-
189
-
190
-
191
-
192
-
193
-
194
-
195
-
196
-
197
-
198
-
199
-
200
-
201
-
202
-
203
-
204
-
205
-
206
-
207
-
208
-
209
-
210
-
211
-
212
-
213
-
214
-
215
-
216
-
217
-
218
-
219
-
220
-
221
-
222
-
223
-
224
-
225
-
226
 |
 |

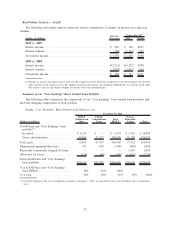
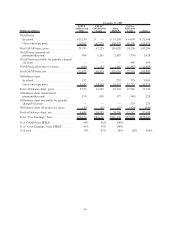
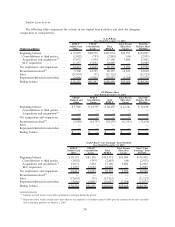
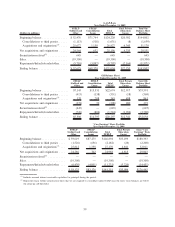
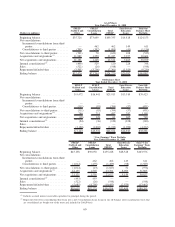
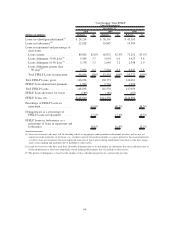
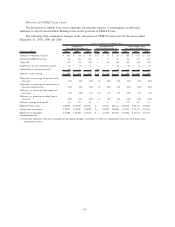
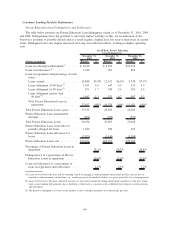
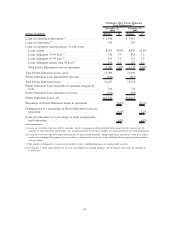
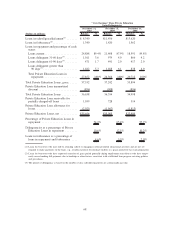
Student Loan Activity
The following tables summarize the activity in our student loan portfolios and show the changing
composition of each portfolio.
(Dollars in millions)
FFELP
Stafford and
Other
FFELP
Consolidation
Loans
Total
FFELP
Total Private
Education
Loans
Total On-
Balance Sheet
Portfolio
GAAP-Basis
Year Ended December 31, 2010
Beginning balance ................ $52,675 $68,379 $121,054 $22,753 $143,807
Consolidations to third parties...... (2,092) (793) (2,885) (46) (2,931)
Acquisitions and originations
(1)
. . . . . 15,672 1,434 17,106 3,896 21,002
SLC acquisition ................ 11,237 13,652 24,889 — 24,889
Net acquisitions and originations . . . . . 24,817 14,293 39,110 3,850 42,960
Securitization-related
(2)
............ 5,500 14,797 20,297 12,341 32,638
Sales .......................... (21,054) (71) (21,125) — (21,125)
Repayments/defaults/resales/other . . . . . (5,686) (5,001) (10,687) (3,288) (13,975)
Ending balance .................. $56,252 $92,397 $148,649 $35,656 $184,305
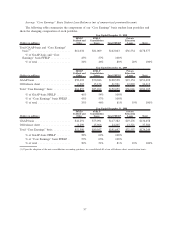
FFELP
Stafford and
Other
FFELP
Consolidation
Loans
Total
FFELP
Total Private
Education
Loans
Total Off-
Balance Sheet
Portfolio
Off-Balance Sheet
Year Ended December 31, 2010
Beginning balance ................ $5,500 $ 14,797 $ 20,297 $ 12,341 $ 32,638
Consolidations to third parties ...... — — — — —
Acquisitions and originations
(1)
..... — — — — —
Net acquisitions and originations ...... — — — — —
Securitization-related
(2)
............. (5,500) (14,797) (20,297) (12,341) (32,638)
Sales .......................... — — — — —
Repayments/defaults/resales/other ..... — — — — —
Ending balance ................... $ — $ — $ — $ — $ —
FFELP
Stafford and
Other
FFELP
Consolidation
Loans
Total
FFELP
Total Private
Education
Loans
Total “Core
Earnings” Basis
Portfolio
GAAP-Basis/‘‘Core Earnings” basis Portfolio
Year Ended December 31, 2010
Beginning balance ............... $58,175 $83,176 $141,351 $35,094 $176,445
Consolidations to third parties . . . . (2,092) (793) (2,885) (46) (2,931)
Acquisitions and originations
(1)
. . . 15,672 1,434 17,106 3,896 21,002
SLC acquisition ............... 11,237 13,652 24,889 — 24,889
Net acquisitions and originations . . . . 24,817 14,293 39,110 3,850 42,960
Securitization-related
(2)
........... — — — — —
Sales ......................... (21,054) (71) (21,125) — (21,125)
Repayments/defaults/resales/other . . . (5,686) (5,001) (10,687) (3,288) (13,975)
Ending balance ................. $56,252 $92,397 $148,649 $35,656 $184,305
(1)
Includes accrued interest receivable capitalized to principal during the period.
(2)
Represents loans within securitization trusts that we are required to consolidate under GAAP upon the adoption of the new consolida-
tion accounting guidance on January 1, 2010.
58