Safeway 2013 Annual Report Download - page 79
Download and view the complete annual report
Please find page 79 of the 2013 Safeway annual report below. You can navigate through the pages in the report by either clicking on the pages listed below, or by using the keyword search tool below to find specific information within the annual report.-
 1
1 -
2
-
3
-
4
-
5
-
6
-
7
-
8
-
9
-
10
-
11
-
12
-
13
-
14
-
15
-
16
-
17
-
18
-
19
-
20
-
21
-
22
-
23
-
24
-
25
-
26
-
27
-
28
-
29
-
30
-
31
-
32
-
33
-
34
-
35
-
36
-
37
-
38
-
39
-
40
-
41
-
42
-
43
-
44
-
45
-
46
-
47
-
48
-
49
-
50
-
51
-
52
-
53
-
54
-
55
-
56
-
57
-
58
-
59
-
60
-
61
-
62
-
63
-
64
-
65
-
66
-
67
-
68
-
 69
69 -
 70
70 -
 71
71 -
 72
72 -
 73
73 -
 74
74 -
 75
75 -
 76
76 -
 77
77 -
 78
78 -
 79
79 -
 80
80 -
 81
81 -
 82
82 -
 83
83 -
 84
84 -
 85
85 -
 86
86 -
 87
87 -
 88
88 -
 89
89 -
90
-
91
-
92
-
93
-
94
-
95
-
96
-
97
-
98
-
99
-
100
-
101
-
102
-
103
-
104
-
105
-
106
-
107
-
108
-
109
-
110
-
111
-
112
-
113
-
114
-
115
-
116
-
117
-
118
-
119
-
120
-
121
-
122
-
123
-
124
-
125
-
126
-
127
-
128
-
129
-
130
-
131
-
132
-
133
-
134
-
135
-
136
-
137
-
138
-
139
-
140
-
141
-
142
-
143
-
144
-
145
-
146
-
147
-
148
-
149
-
150
-
151
-
152
-
153
-
154
-
155
-
156
-
157
-
158
-
159
-
160
-
161
-
162
-
163
-
164
-
165
-
166
-
167
-
168
-
169
-
170
-
171
-
172
-
173
-
174
-
175
-
176
-
177
-
178
-
179
-
180
-
181
-
182
-
183
-
184
-
185
-
186
-
187
-
188
 |
 |
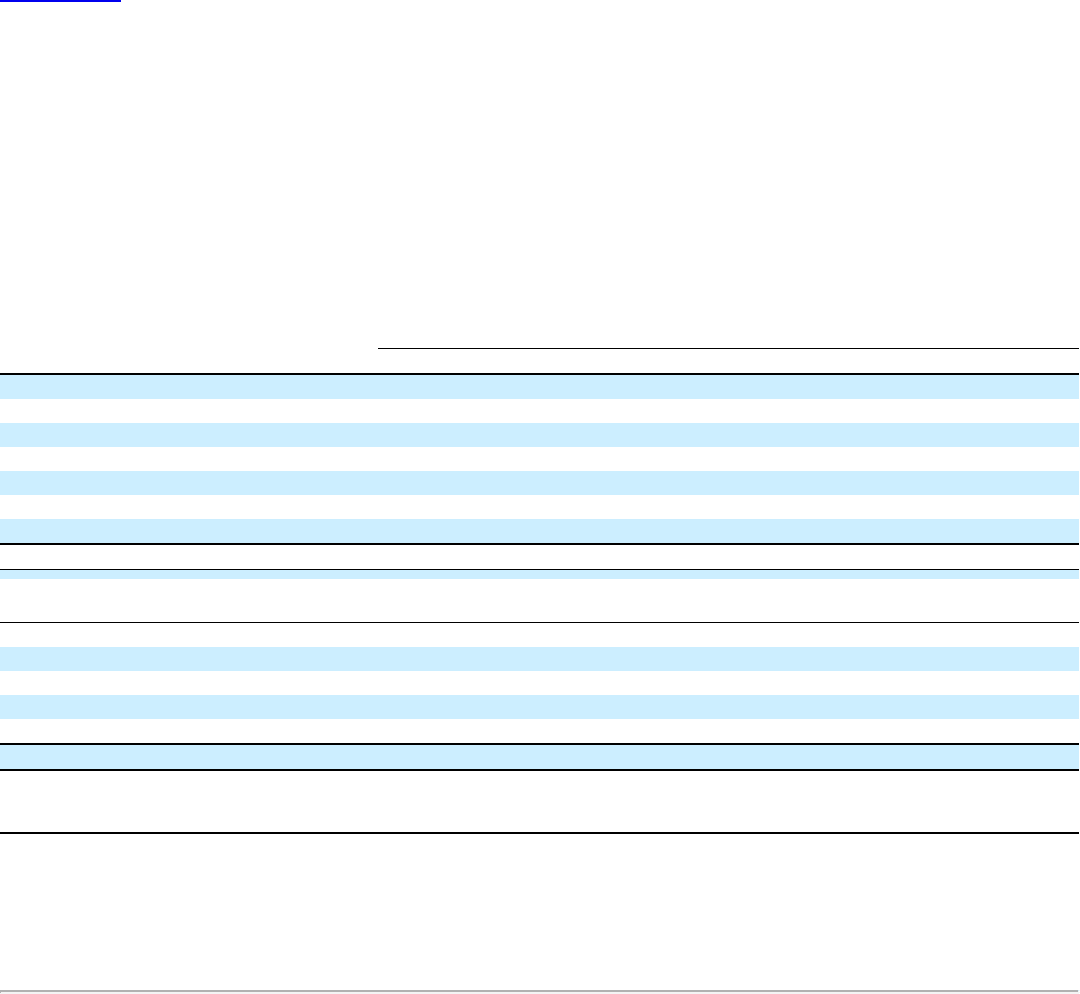
Table of Contents
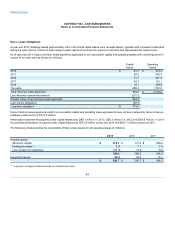
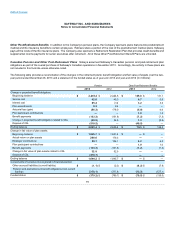
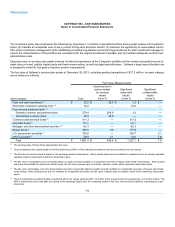
The following tables provide the components of net expense for the retirement plans and other changes in plan assets and benefit obligations
recognized in other comprehensive income (in millions):
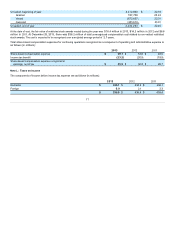
Pension
Other Post-Retirement
Benefits
Components of net expense: 2012 2011
2012 2011
Estimated return on plan assets $(101.0)$(116.0)
$—$—
Service cost 40.3 37.8
0.6 0.6
Interest cost 91.8 100.0
3.6 4.4
Settlement loss 5.9 1.1
— —
Curtailment loss 1.8 —
— —
Amortization of prior service cost (credit) 15.3 17.4
(0.1)(0.1)
Amortization of net actuarial loss 70.3 53.3
0.5 0.4
Net expense $ 124.4 $ 93.6
$ 4.6 $ 5.3
Changes in plan assets and benefit obligations
recognized in other comprehensive income:
Net actuarial (gain) loss $97.8 $228.6
$ 6.6 $ 3.4
Recognition of net actuarial loss (76.3)(54.4)
(0.5)(0.4)
Prior service credit 0.5 1.0
— —
Recognition of prior service (cost) credit (17.0)(17.4)
0.1 0.1
Changes relating to discontinued operations 9.0 87.4
(5.0)(6.7)
Total recognized in other comprehensive income 14.0 245.2
1.2 (3.6)
Total net expense and changes in plan assets and
benefit obligations recognized in comprehensive
income $138.4 $338.8
$5.8 $1.7
Prior service costs are amortized on a straight-line basis over the average remaining service period of active participants. Actuarial gains and
losses are amortized over the average remaining service life of active participants when the accumulation of such gains and losses exceeds
10% of the greater of the projected benefit obligation and the fair value of plan assets. The Company uses its fiscal year-end date as the
measurement date for its plans.
77