Safeway 2004 Annual Report Download - page 24
Download and view the complete annual report
Please find page 24 of the 2004 Safeway annual report below. You can navigate through the pages in the report by either clicking on the pages listed below, or by using the keyword search tool below to find specific information within the annual report.
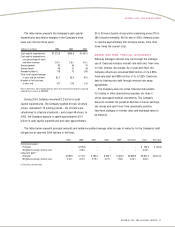
from Safeway’s former Florida division. In 2002, Furr’s and
Homeland emerged from bankruptcy and, based on the
resolution of various leases, Safeway reversed $12.1 million
of this accrual.
SALES Total sales increased only slightly to $35.8 billion in
2004 from $35.7 billion in 2003, primarily because of the
strike and because fiscal 2004 had one fewer week than
fiscal 2003.
Historically, Safeway has classified certain minor revenue
items such as partner gift card and vending machine income
as a reduction of costs and expenses. As the value of these
items has grown, the Company has determined that they are
more appropriately classified as other revenue in 2004.
These items have been reclassified for prior periods to
conform to the 2004 presentation. These reclassifications
had no effect on previously reported operating profit or net
income (loss) and are summarized below (in millions):
2004 2003 2002
Sales, before reclassifications $ 35,621.9 $ 35,552.7 $ 34,767.5
Reclassifications 201.0 174.5 149.7
Sales and other revenue,
as adjusted $ 35,822.9 $ 35,727.2 $ 34,917.2
Cost of goods sold, before
reclassifications $(25,230.0) $(25,018.9) $(23,955.5)
Reclassifications 2.4 15.9 34.7
Cost of good sold, as adjusted $(25,227.6) $(25,003.0) $(23,920.8)
Gross profit, before
reclassifications $ 10,391.9 $ 10,533.8 $ 10,812.0
Reclassifications 203.4 190.4 184.4
Gross profit, as adjusted $ 10,595.3 $ 10,724.2 $ 10,996.4
Operating and administrative
expense, before
reclassifications $ (9,219.1) $ (9,230.8) $ (8,576.4)
Reclassifications (203.4) (190.4) (184.4)
Operating and administrative
expense, as adjusted $ (9,422.5) $ (9,421.2) $ (8,760.8)
These reclassifications did not change previously
reported comparable-store sales or identical-store sales by
more than 10 basis points in either 2004, 2003 or 2002.
Same-store sales increases (decreases) for 2004 were
as follows:
Comparable-Store Identical-Store
Sales (includes Sales (excludes
replacement stores) replacement stores)
Including Fuel:
Excluding strike-affected stores 1.5% 0.9%
Including strike-affected stores 0.9% 0.3%
Excluding Fuel:
Excluding strike-affected stores (0.2%) (0.8%)
Including strike-affected stores (0.7%) (1.3%)
In 2003, total sales increased 2.3% to $35.7 billion from
$34.9 billion in 2002 due primarily to the additional week in
2003, new store openings and additional fuel sales, partially
offset by the estimated impact of the strike in Southern
California. Excluding the estimated effects of the strike in
Southern California, comparable-store sales were flat, while
identical-store sales declined 0.4%. Further excluding the
effects of fuel sales, 2003 comparable-store sales
decreased 1.6% and identical-store sales decreased 2.0%.
In 2002, comparable-store sales decreased by 0.7%,
while identical-store sales declined 1.7%. Excluding the
effects of fuel sales, 2002 comparable-store sales decreased
1.3% and identical-store sales decreased 2.2%. Sales in
2002 were impacted by continued softness in the economy,
an increase in competitive activity, an overly aggressive
shrink-reduction effort and disruptions associated with the
centralization of buying and merchandising.
22 SAFEWAY INC. 2004 ANNUAL REPORT
SAFEWAY INC. AND SUBSIDIARIES
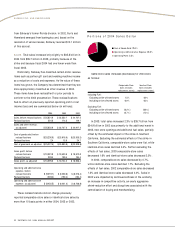
Portions of 2004 Sales Dollar
■ Cost of Goods Sold: 70.4%
■ Operating & Administrative Expense: 26.3%
■ Operating Profit: 3.3%


