Safeway 1997 Annual Report Download - page 40
Download and view the complete annual report
Please find page 40 of the 1997 Safeway annual report below. You can navigate through the pages in the report by either clicking on the pages listed below, or by using the keyword search tool below to find specific information within the annual report.-
 1
1 -
2
-
3
-
4
-
5
-
6
-
7
-
8
-
9
-
10
-
11
-
12
-
13
-
14
-
15
-
16
-
17
-
18
-
19
-
20
-
21
-
22
-
23
-
24
-
25
-
26
-
27
-
28
-
29
-
 30
30 -
 31
31 -
 32
32 -
 33
33 -
 34
34 -
 35
35 -
 36
36 -
 37
37 -
 38
38 -
 39
39 -
 40
40 -
 41
41 -
 42
42 -
 43
43 -
 44
44
 |
 |

37
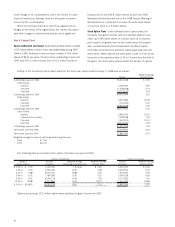
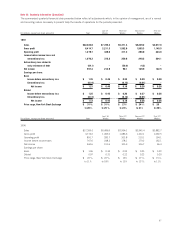
Note M: Quarterly Information (Unaudited)
The summarized quarterly fianancial data presented below reflect all adjustments which, in the opinion of management, are of a normal
and recurring nature necessary to present fairly the results of operations for the periods presented.
Last 17 Third 12 Second 12 First 12
(In millions, except per-share amounts) Year Weeks Weeks Weeks Weeks
1997
Sales $22,483.8 $7,785.4 $5,371.4 $5,249.2 $4,077.8
Gross profit 6,414.7 2,211.3 1,552.6 1,505.3 1,145.5
Operating profit 1,279.7 439.6 317.3 298.0 224.8
Income before income taxes and
extraordinary loss 1,076.3 372.2 259.8 240.2 204.1
Extraordinary loss related to
early retirement of debt (64.1) – (59.9) (4.2) –
Net income 557.4 214.9 90.1 129.9 122.5
Earnings per share:
Basic
Income before extraordinary loss $ 1.35 $ 0.46 $ 0.32 $ 0.29 $ 0.28
Extraordinary loss (0.14) – (0.13) (0.01) –
■■■■■■■■■■■■
Net income $ 1.21 $ 0.46 $ 0.19 $ 0.28 $ 0.28
■■■■■■■■■■■■
Diluted
Income before extraordinary loss $ 1.25 $ 0.43 $ 0.30 $ 0.27 $ 0.26
Extraordinary loss (0.13) – (0.12) (0.01) –
■■■■■■■■■■■■
Net income $ 1.12 $ 0.43 $ 0.18 $ 0.26 $ 0.26
■■■■■■■■■■■■
Price range, New York Stock Exchange $ 3123⁄32 $31
23⁄32 $27
3
⁄4$24
13⁄16 $26
to 209⁄16 to 2511⁄32 to 231⁄16 to 211⁄8to 209⁄16
Last 16 Third 12 Second 12 First 12
(In millions, except per-share amounts) Year Weeks Weeks Weeks Weeks
1996
Sales $17,269.0 $5,486.9 $3,954.0 $3,945.4 $3,882.7
Gross profit 4,774.2 1,493.0 1,086.6 1,102.1 1,092.5
Operating profit 891.7 283.7 203.8 210.1 194.1
Income before income taxes 767.6 248.2 178.1 179.2 162.1
Net income 460.6 151.6 105.9 106.7 96.4
Earnings per share:
Basic $ 1.06 $ 0.34 $ 0.24 $ 0.25 $ 0.22
Diluted 0.97 0.31 0.22 0.22 0.20
Price range, New York Stock Exchange $ 2211⁄16 $22
11⁄16 $19
1
⁄8$17
13⁄16 $15
1
⁄16
to 117
⁄32 to 185⁄8to 157⁄8to 1313⁄16 to 117⁄32