Saab 2011 Annual Report Download - page 5
Download and view the complete annual report
Please find page 5 of the 2011 Saab annual report below. You can navigate through the pages in the report by either clicking on the pages listed below, or by using the keyword search tool below to find specific information within the annual report.-
 1
1 -
 2
2 -
 3
3 -
 4
4 -
 5
5 -
 6
6 -
 7
7 -
 8
8 -
 9
9 -
 10
10 -
 11
11 -
 12
12 -
 13
13 -
 14
14 -
 15
15 -
 16
16 -
17
-
18
-
19
-
20
-
21
-
22
-
23
-
24
-
25
-
26
-
27
-
28
-
29
-
30
-
31
-
32
-
33
-
34
-
35
-
36
-
37
-
38
-
39
-
40
-
41
-
42
-
43
-
44
-
45
-
46
-
47
-
48
-
49
-
50
-
51
-
52
-
53
-
54
-
55
-
56
-
57
-
58
-
59
-
60
-
61
-
62
-
63
-
64
-
65
-
66
-
67
-
68
-
69
-
70
-
71
-
72
-
73
-
74
-
75
-
76
-
77
-
78
-
79
-
80
-
81
-
82
-
83
-
84
-
85
-
86
-
87
-
88
-
89
-
90
-
91
-
92
-
93
-
94
-
95
-
96
-
97
-
98
-
99
-
100
-
101
-
102
-
103
-
104
-
105
-
106
-
107
-
108
-
109
-
110
-
111
-
112
-
113
-
114
-
115
-
116
-
117
-
118
-
119
-
120
-
121
-
122
-
123
-
124
-
125
-
126
-
127
-
128
-
129
-
130
-
131
-
132
-
133
-
134
-
135
-
136
-
137
-
138
-
139
-
140
-
141
-
142
-
143
-
144
-
145
-
146
-
147
-
148
-
149
-
150
-
151
-
152
-
153
-
154
-
155
-
156
-
157
-
158
 |
 |

SAAB ANNUAL REPORT 2011 1
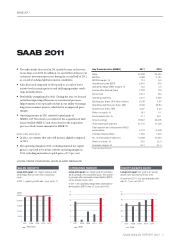
SAAB 2011
SAAB 2011
tćFPSEFSJOUBLFEFDSFBTFEJOQBSUMZCFDBVTFPSEFSTXFSF
OPUBTMBSHFBTJO*OBEEJUJPOXFTBXGVSUIFSEFMBZTJOPVS
DVTUPNFSTJOWFTUNFOUQSPDFTTFTEVSJOHUIFTFDPOEIBMGPG
BTBSFTVMUPGTVCEVFEHMPCBMFDPOPNJDDPOEJUJPOT
t4BMFTEFDSFBTFEDPNQBSFEUPQBSUMZBTBSFTVMUPGMPXFS
BDUJWJUZMFWFMTJONBKPSQSPKFDUTBOEDIBMMFOHJOHNBSLFUDPOEJ-
UJPOTJO4PVUI"GSJDB
t1SPĕUBCJMJUZTUSFOHUIFOFEJO%VSJOHUIFZFBSXFGPDVTFE
POGVSUIFSJNQSPWJOHFďDJFODJFTJOPVSJOUFSOBMQSPDFTTFT
*NQSPWFNFOUTXFSFFTQFDJBMMZFWJEFOUJOPVSBCJMJUZUPNBOBHF
MPOHUFSNDVTUPNFSQSPKFDUTXIJDIMFEUPBOJNQSPWFEHSPTT
NBSHJO
t0QFSBUJOHJODPNFJOJODMVEFEDBQJUBMHBJOTPG
.4&,ڀ4USVDUVSBMDPTUTSFMBUFEUPUIFBDRVJTJUJPOPG4BBC
4FOTJTUPUBMMFE.4&,BOEDPTUTSFMBUFEUPUIFBDRVJTJUJPO
QSPDFTTPG4BBC4FOTJTBNPVOUFEUP.4&,
OUTLOOK FOR 2012:
t*OXFFTUJNBUFUIBUTBMFTXJMMJODSFBTFTMJHIUMZDPNQBSFE
UP
tćFPQFSBUJOHNBSHJOJOFYDMVEJOHNBUFSJBMOFUDBQJUBM
HBJOTJTFYQFDUFEUPCFJOMJOFXJUIUIFPQFSBUJOHNBSHJOJO
FYDMVEJOHNBUFSJBMOFUDBQJUBMHBJOTPGQFSDFOU
Key financial ratios (MSEK) 2011 2010
Sales 23,498 24,434
EBITDA 4,088 2,187
EBITDA margin, % 17.4 9.0
Operating income (EBIT) 2,941 975
Operating margin (EBIT margin), % 12.5 4.0
Income after financial items 2,783 776
Net income 2,217 454
Operating cash flow 2,477 4,349
Earnings per share, SEK (after dilution) 20.38 3.97
Operating cash flow per share, SEK 22.69 39.84
Dividend per share, SEK 4.501) 3.50
Return on equity, % 18.1 4.1
Equity/assets ratio, % 41.1 39.1
Order bookings 18,907 26,278
Order backlog at year-end 37,172 41,459
Total research and development (R&D)
expenditures 5,116 5,008
Internally financed R&D 1,355 1,203
No. of employees at year-end 13,068 12,536
Share of women, % 22.0 22.0
Academic degree, % 54.1 51.4
1SPQPTBMCZ#PBSEPG%JSFDUPST
LONG-TERM FINANCIAL GOALS AND RESULTS
SALES GROWTH
Long-term goal: Our organic sales growth
will average five per cent over a business
cycle.
In 2011, organic growth was -4 per cent (-1).
20112010200920082007
0
5,000
10,000
15,000
20,000
25,000
MSEK
Trend line
OPERATING MARGIN
Long-term goal: Our margin goal is formulated
as an average over a business cycle. The operat-
ing margin after depreciation/amortisation (EBIT)
will be at least 10 per cent.
In 2011, the operating margin after depreciation/
amortisation (EBIT) was 12.5 per cent (4.0).
20112010200920082007
0
3
6
9
12
15
%
Goal
EQUITY/ASSETS RATIO
Long-term goal: Our goal is an equity/
assets ratio exceeding 30 per cent.
At year-end 2011, the equity/assets ratio
was 41.1 per cent (39.1).
2
20112010200920082007
0
10
20
30
40
50
%
Goal