Royal Caribbean Cruise Lines 2013 Annual Report Download - page 51
Download and view the complete annual report
Please find page 51 of the 2013 Royal Caribbean Cruise Lines annual report below. You can navigate through the pages in the report by either clicking on the pages listed below, or by using the keyword search tool below to find specific information within the annual report.-
 1
1 -
2
-
3
-
4
-
5
-
6
-
7
-
8
-
9
-
10
-
11
-
12
-
13
-
14
-
15
-
16
-
17
-
18
-
19
-
20
-
21
-
22
-
23
-
24
-
25
-
26
-
27
-
28
-
29
-
30
-
31
-
32
-
33
-
34
-
35
-
36
-
37
-
38
-
39
-
40
-
 41
41 -
 42
42 -
 43
43 -
 44
44 -
 45
45 -
 46
46 -
 47
47 -
 48
48 -
 49
49 -
 50
50 -
 51
51 -
 52
52 -
 53
53 -
 54
54 -
 55
55 -
 56
56 -
 57
57 -
 58
58 -
 59
59 -
 60
60 -
 61
61 -
62
-
63
-
64
-
65
-
66
-
67
-
68
-
69
-
70
-
71
-
72
-
73
-
74
-
75
-
76
-
77
-
78
-
79
-
80
-
81
-
82
-
83
-
84
-
85
-
86
-
87
-
88
-
89
-
90
-
91
-
92
-
93
-
94
-
95
-
96
-
97
-
98
-
99
-
100
-
101
-
102
-
103
-
104
-
105
-
106
-
107
-
108
 |
 |

49
PART II
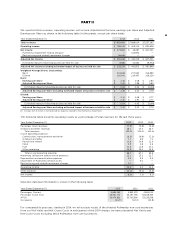
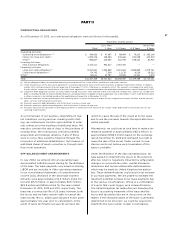
We reported total revenues, operating income, net income, Adjusted Net Income, earnings per share and Adjusted
Earnings per Share as shown in the following table (in thousands, except per share data):
Year Ended December 31,
Total revenues
Operating income
Net income
Pullmantur impairment related charges(1) — —
Restructuring and related impairment charges — —
Adjusted Net Income
Estimated impact of divesting businesses held for sale ()
Adjusted Net Income excluding estimated impact of businesses held for sale
Weighted-Average Shares Outstanding:
Basic
Diluted
Basic:
Earnings per Share
Adjusted Earnings per Share
Estimated impact of divesting businesses held for sale ()
Adjusted Earnings per Share excluding estimated impact of businesses held for sale
Diluted:
Earnings per Share
Adjusted Earnings per Share
Estimated impact of divesting businesses held for sale ()
Adjusted Earnings per Share excluding estimated impact of businesses held for sale
() Includes $28.5 million in net deferred tax expense related to the Pullmantur impairment.
The following table presents operating results as a percentage of total revenues for the last three years:
Year Ended December 31,
Passenger ticket revenues
Onboard and other revenues
Total revenues
Cruise operating expenses:
Commissions, transportation and other
Onboard and other
Payroll and related
Food
Fuel
Other operating
Total cruise operating expenses
Marketing, selling and administrative expenses
Depreciation and amortization expenses
Impairment of Pullmantur related assets — —
Restructuring and related impairment charges — —
Operating income
Other expense () () ()
Net income
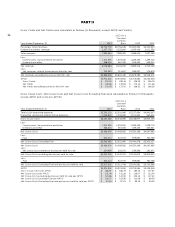
Selected statistical information is shown in the following table:
Year Ended December 31,
Passengers Carried
Passenger Cruise Days
APCD
Occupancy
For comparability purposes, starting in 2014, we will exclude results of the divested Pullmantur non-core businesses
from our Net Yields and Net Cruise Costs. In anticipation of the 2014 change, we have presented Net Yields and
Net Cruise Costs excluding these Pullmantur non-core businesses.