Ross 2010 Annual Report Download - page 2
Download and view the complete annual report
Please find page 2 of the 2010 Ross annual report below. You can navigate through the pages in the report by either clicking on the pages listed below, or by using the keyword search tool below to find specific information within the annual report.-
 1
1 -
 2
2 -
 3
3 -
 4
4 -
 5
5 -
 6
6 -
 7
7 -
 8
8 -
 9
9 -
 10
10 -
 11
11 -
 12
12 -
 13
13 -
14
-
15
-
16
-
17
-
18
-
19
-
20
-
21
-
22
-
23
-
24
-
25
-
26
-
27
-
28
-
29
-
30
-
31
-
32
-
33
-
34
-
35
-
36
-
37
-
38
-
39
-
40
-
41
-
42
-
43
-
44
-
45
-
46
-
47
-
48
-
49
-
50
-
51
-
52
-
53
-
54
-
55
-
56
-
57
-
58
-
59
-
60
-
61
-
62
-
63
-
64
-
65
-
66
-
67
-
68
-
69
-
70
-
71
-
72
-
73
-
74
 |
 |

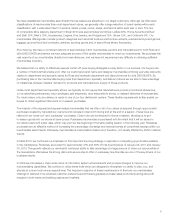
2
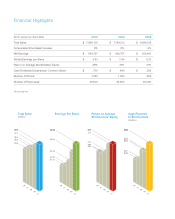
Cash Returned
to Stockholders
($ millions)
Total Sales
($ billions)
Earnings Per Share Return on Average
Stockholders’ Equity
$7.9
$7.2
$6.5
$6.0
$5.6
06
07
08
09
10
$4.63
$3.54
$2.33
$1.90
$1.70
06
07
08
09
10
45%
41%
31%
28%
28%
06
07
08
09
10
$452
$355
$350
$241
$234
06
07
08
09
10
1At fi scal year end.
Financial Highlights
($000, except per share data) 2010 2009 2008
Total Sales $ 7,866,100 $ 7,184,213 $ 6,486,139
Comparable Store Sales Increase 5% 6% 2%
Net Earnings $ 554,797 $ 442,757 $ 305,441
Diluted Earnings per Share $ 4.63 $ 3.54 $ 2.33
Return on Average Stockholders’ Equity 45% 41% 31%
Cash Dividends Declared per Common Share $ .700 $ .490 $ .395
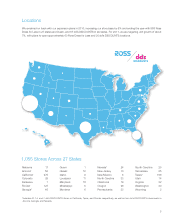
Number of Stores1 1,055 1,005 956
Number of Employees1 49,500 45,600 40,000