Ross 2009 Annual Report Download - page 4
Download and view the complete annual report
Please find page 4 of the 2009 Ross annual report below. You can navigate through the pages in the report by either clicking on the pages listed below, or by using the keyword search tool below to find specific information within the annual report.-
 1
1 -
 2
2 -
 3
3 -
 4
4 -
 5
5 -
 6
6 -
 7
7 -
 8
8 -
 9
9 -
 10
10 -
 11
11 -
 12
12 -
 13
13 -
 14
14 -
 15
15 -
16
-
17
-
18
-
19
-
20
-
21
-
22
-
23
-
24
-
25
-
26
-
27
-
28
-
29
-
30
-
31
-
32
-
33
-
34
-
35
-
36
-
37
-
38
-
39
-
40
-
41
-
42
-
43
-
44
-
45
-
46
-
47
-
48
-
49
-
50
-
51
-
52
-
53
-
54
-
55
-
56
-
57
-
58
-
59
-
60
-
61
-
62
-
63
-
64
-
65
-
66
-
67
-
68
-
69
-
70
-
71
-
72
-
73
-
74
-
75
-
76
 |
 |
— 2 —
We are very pleased with our exceptional performance in fiscal 2009. Strong execution
of our value-focused strategies enabled us to deliver much better-than-planned
revenues while achieving double digit operating profits as a percent of sales. These
results reflect the resilience of our off-price business model and demonstrate that
bargains are always in style!
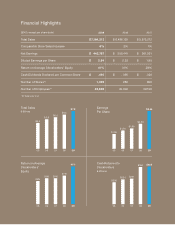
Record Sales and Earnings
For the 52 weeks ended January 30, 2010, sales increased 11% to a record $7.2 billion,
with same store sales up 6% on top of a 2% gain in the prior year. Dresses, Shoes and
Home were our best performing merchandise categories in 2009, while the Mid-Atlantic
and Southeast regions had the largest same store sales gains.
Net earnings for the year grew 45% to a record $442.8 million, up from $305.4 million in
2008. Earnings per share rose 52% to $3.54, on top of a 23% increase in 2008. Operating
margin increased about 250 basis points to 10.1%. Key drivers of this significant
improvement in profitability were much higher gross margin and increased leverage on
operating expenses from the healthy gains in same store sales.
Strong Inventory Management Increases Profitability
As we ended 2009, average in-store inventories were down about 11% on top of a 14%
decline in the prior year. We plan to further reduce in-store inventories in 2010, with
average store levels targeted to be down in the mid-to-high-single digit percentage range
compared to 2009.
Operating the business on lower inventory levels increases the percentage of fresh and
exciting merchandise customers see when they shop our stores. By exceeding our sales
targets with leaner inventories, we also realized significantly faster turns in 2009, which
resulted in much fewer markdowns.
Looking ahead, we believe this ongoing focus on strict inventory management will
continue to help us speed inventory turns and maximize merchandise gross margin.
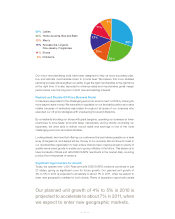
Expansion Continues as Planned
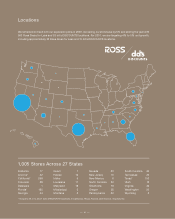
We added 56 new stores in 2009, consisting of 52 Ross and four dd’s DISCOUNTS
locations. We ended 2009 with 1,005 locations in 27 states and Guam. For 2010, we
are planning total unit expansion of about 4% to 5%, with approximately 35 new Ross
and 15 new dd’s DISCOUNTS stores.
Accelerating Growth at dd’s DISCOUNTS
Significant progress was made over the past year at dd’s DISCOUNTS, where sales and
operating profits were also well ahead of our original expectations. In fact, the earnings
Earnings per share rose 52% to $3.54 on top of
a 23% increase in 2008.
To our Stockholders