Redbox 2014 Annual Report Download - page 88
Download and view the complete annual report
Please find page 88 of the 2014 Redbox annual report below. You can navigate through the pages in the report by either clicking on the pages listed below, or by using the keyword search tool below to find specific information within the annual report.-
 1
1 -
2
-
3
-
4
-
5
-
6
-
7
-
8
-
9
-
10
-
11
-
12
-
13
-
14
-
15
-
16
-
17
-
18
-
19
-
20
-
21
-
22
-
23
-
24
-
25
-
26
-
27
-
28
-
29
-
30
-
31
-
32
-
33
-
34
-
35
-
36
-
37
-
38
-
39
-
40
-
41
-
42
-
43
-
44
-
45
-
46
-
47
-
48
-
49
-
50
-
51
-
52
-
53
-
54
-
55
-
56
-
57
-
58
-
59
-
60
-
61
-
62
-
63
-
64
-
65
-
66
-
67
-
68
-
69
-
70
-
71
-
72
-
73
-
74
-
75
-
76
-
77
-
 78
78 -
 79
79 -
 80
80 -
 81
81 -
 82
82 -
 83
83 -
 84
84 -
 85
85 -
 86
86 -
 87
87 -
 88
88 -
 89
89 -
 90
90 -
 91
91 -
 92
92 -
 93
93 -
 94
94 -
 95
95 -
 96
96 -
 97
97 -
 98
98 -
99
-
100
-
101
-
102
-
103
-
104
-
105
-
106
-
107
-
108
-
109
-
110
-
111
-
112
-
113
-
114
-
115
-
116
-
117
-
118
-
119
-
120
-
121
-
122
-
123
-
124
-
125
-
126
 |
 |

80
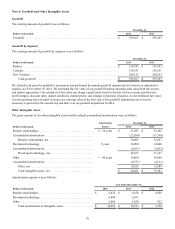
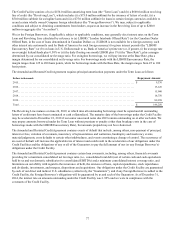
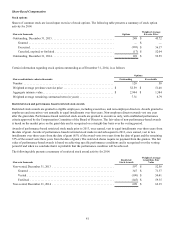
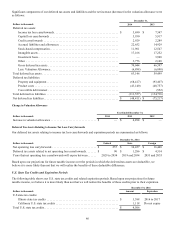
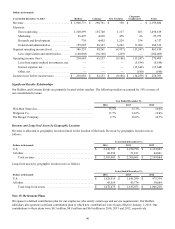
Certain information regarding our share-based payments is as follows:
Year Ended December 31,
Dollars in thousands except per share data 2014 2013 2012
Share-based payments expense:
Share-based compensation - stock options . . . . . . . . . . . . . . . . . $ 803 $ 1,566 $ 2,654
Share-based compensation - restricted stock . . . . . . . . . . . . . . . . 11,214 10,504 10,593
Share-based payments for content arrangements. . . . . . . . . . . . . 1,367 4,761 6,115
Total share-based payments expense. . . . . . . . . . . . . . . . . . . . . $ 13,384 $ 16,831 $ 19,362
Tax benefit on share-based payments expense . . . . . . . . . . . . . . . . . . $ 5,134 $ 6,392 $ 7,246
Per share weighted average grant date fair value of stock options
granted. . . . . . . . . . . . . . . . . . . . . . . . . . . . . . . . . . . . . . . . . . . . . . . . . $ — $ 53.90 $ 27.24
Per share weighted average grant date fair value of restricted stock
granted. . . . . . . . . . . . . . . . . . . . . . . . . . . . . . . . . . . . . . . . . . . . . . . . . $ 71.37 $ 53.94 $ 55.94
Total intrinsic value of stock options exercised . . . . . . . . . . . . . . . . . $ 3,263 $ 10,567 $ 10,509
Grant date fair value of restricted stock vested. . . . . . . . . . . . . . . . . . $ 13,036 $ 12,641 $ 11,648
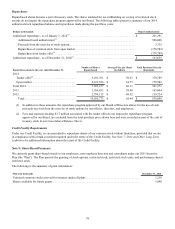
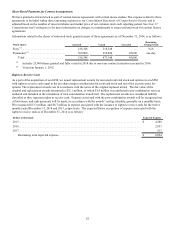
December 31, 2014
Dollars in thousands
Unrecognized Share-
Based Payments
Expense
Weighted-Average
Remaining Life
Unrecognized share-based payments expense:
Share-based compensation - stock options . . . . . . . . . . . . . . . . . . . . . . . . . . . . . . . $ 863 1.8 years
Share-based compensation - restricted stock. . . . . . . . . . . . . . . . . . . . . . . . . . . . . . 20,714 2.1 years
Share-based payments for content arrangements (1) . . . . . . . . . . . . . . . . . . . . . . . . 1,041 0.8 years
Total unrecognized share-based payments expense. . . . . . . . . . . . . . . . . . . . . $ 22,618
(1) Related to 25,000 shares of restricted stock granted to Sony in connection with extending our existing content license
agreement. The unrecognized expense associated with these vested shares is recognized over the agreement term.