Rayovac 2004 Annual Report Download - page 3
Download and view the complete annual report
Please find page 3 of the 2004 Rayovac annual report below. You can navigate through the pages in the report by either clicking on the pages listed below, or by using the keyword search tool below to find specific information within the annual report.-
 1
1 -
 2
2 -
 3
3 -
 4
4 -
 5
5 -
 6
6 -
 7
7 -
 8
8 -
 9
9 -
 10
10 -
 11
11 -
 12
12 -
 13
13 -
 14
14 -
15
-
16
-
17
-
18
-
19
-
20
-
21
-
22
-
23
-
24
-
25
-
26
-
27
-
28
-
29
-
30
-
31
-
32
-
33
-
34
-
35
-
36
-
37
-
38
-
39
-
40
-
41
-
42
-
43
-
44
-
45
-
46
-
47
-
48
-
49
-
50
-
51
-
52
-
53
-
54
-
55
-
56
-
57
-
58
-
59
-
60
-
61
-
62
-
63
-
64
-
65
-
66
-
67
-
68
-
69
-
70
-
71
-
72
-
73
-
74
-
75
-
76
-
77
-
78
-
79
-
80
-
81
-
82
-
83
-
84
-
85
-
86
-
87
-
88
-
89
-
90
-
91
-
92
-
93
-
94
-
95
-
96
-
97
-
98
-
99
-
100
-
101
-
102
-
103
-
104
-
105
-
106
-
107
-
108
-
109
-
110
-
111
-
112
-
113
-
114
-
115
 |
 |

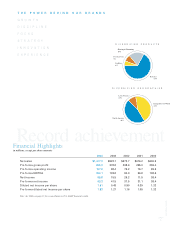
Recordachievement
2004 2003 2002 2001 2000
Netsales $1,417.2 $922.1 $572.7 $616.2 $630.9
Proformagrossprofit 605.3 378.8 238.6 255.0 259.4
Proformaoperatingincome 167.6 98.4 76.2 76.7 89.3
ProformaEBITDA 202.1 133.8 94.0 96.8 108.6
Netincome 55.8 15.5 29.2 11.5 38.4
Proformanetincome 63.3 41.5 37.5 31.1 38.4
Dilutednetincomepershare 1.61 0.48 0.90 0.39 1.32
Proformadilutednetincomepershare 1.83 1.27 1.16 1.05 1.32
Note:SeeTableonpage13forreconciliationtoU.S.GAAPfinancialresults.
FinancialHighlights
inmillions,exceptpershareamounts
T H E P O W E R B E H I N D O U R B R A N D S
G R O W T H
D I S C I P L I N E
F O C U S
S T R A T E G Y
I N N O V A T I O N
E X P E R I E N C E
RayovacCorporation
page
1.
Shaving & Grooming
19%
Batteries
67%
Lighting
6%
Personal Care
8%
Latin America
10%
North America
46%
Europe/Rest of World
44%
D I V E R S I F I E D G E O G R A P H I E S
D I V E R S I F I E D P R O D U C T S