Rayovac 2003 Annual Report Download - page 3
Download and view the complete annual report
Please find page 3 of the 2003 Rayovac annual report below. You can navigate through the pages in the report by either clicking on the pages listed below, or by using the keyword search tool below to find specific information within the annual report.-
 1
1 -
 2
2 -
 3
3 -
 4
4 -
 5
5 -
 6
6 -
 7
7 -
 8
8 -
 9
9 -
 10
10 -
 11
11 -
 12
12 -
 13
13 -
 14
14 -
15
-
16
-
17
-
18
-
19
-
20
-
21
-
22
-
23
-
24
-
25
-
26
-
27
-
28
-
29
-
30
-
31
-
32
-
33
-
34
-
35
-
36
-
37
-
38
-
39
-
40
-
41
-
42
-
43
-
44
-
45
-
46
-
47
-
48
-
49
-
50
-
51
-
52
-
53
-
54
-
55
-
56
-
57
-
58
-
59
-
60
-
61
-
62
-
63
-
64
-
65
-
66
-
67
-
68
-
69
-
70
 |
 |

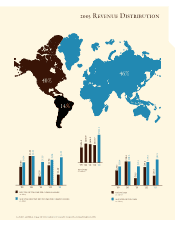
2003 Revenue Distribution
’02
$41.5
$37.5
$31.1
$38.4
$30.4
$15.5
$29.2
$11.5
$38.4
$24.1
’03’01’00
ADJUSTED NET INCOME
(in millions)
’99
NET INCOME
(in millions)
’02
$1.27
$1.16
$1.05
$1.32
$1.04
$0.48
$0.90
$0.39
$1.32
$0.83
’03’01’00
ADJUSTED DILUTED NET INCOME PER COMMON SHARE
(in dollars)
DILUTED NET INCOME PER COMMON SHARE
(in dollars)
’99
’02
$616.2
$630.9
$504.2
REVENUES
(in millions)
’03’01’00
’99
$922.1
$572.7
40%
14%
46%
See Table 1 and Table 2 on page 12 for Reconciliation to Generally Accepted Accounting Principles (GAAP).