Public Storage 2011 Annual Report Download - page 5
Download and view the complete annual report
Please find page 5 of the 2011 Public Storage annual report below. You can navigate through the pages in the report by either clicking on the pages listed below, or by using the keyword search tool below to find specific information within the annual report.-
 1
1 -
 2
2 -
 3
3 -
 4
4 -
 5
5 -
 6
6 -
 7
7 -
 8
8 -
 9
9 -
 10
10 -
 11
11 -
 12
12 -
 13
13 -
 14
14 -
 15
15 -
 16
16 -
17
-
18
-
19
-
20
-
21
-
22
-
23
-
24
-
25
-
26
-
27
-
28
-
29
-
30
-
31
-
32
-
33
-
34
-
35
-
36
-
37
-
38
-
39
-
40
-
41
-
42
-
43
-
44
-
45
-
46
-
47
-
48
-
49
-
50
-
51
-
52
-
53
-
54
-
55
-
56
-
57
-
58
-
59
-
60
-
61
-
62
-
63
-
64
-
65
-
66
-
67
-
68
-
69
-
70
-
71
-
72
-
73
-
74
-
75
-
76
-
77
-
78
-
79
-
80
-
81
-
82
-
83
-
84
-
85
-
86
-
87
-
88
-
89
-
90
-
91
-
92
-
93
-
94
-
95
-
96
-
97
-
98
-
99
-
100
-
101
-
102
-
103
-
104
-
105
-
106
-
107
-
108
-
109
-
110
-
111
-
112
-
113
-
114
-
115
-
116
-
117
-
118
-
119
-
120
-
121
-
122
-
123
-
124
 |
 |

Net Operating Income
(Amounts in millions)
2011 2010
U.S. self-storage operations $ 1,103 $ 1,019
European self-storage operations 61 43
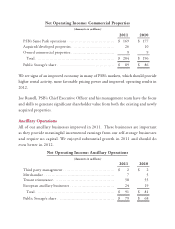
Commercial properties 89 86
Ancillary operations 79 68
Total $ 1,332 $ 1,216
Net operating income (property and ancillary business income, excluding depreciation,
general and administrative and financing costs) reflects unleveraged returns from
capital investments and management’s operating skills. When evaluating our net
operating income, we focus on our “Same Store” properties (properties that we
have operated on a stabilized basis for at least three years), because they reflect
the fundamental strength of our business and the efficacy of our personnel and
operating strategies.
U.S. Self-Storage
Our U.S. self-storage operations generated higher net operating income due to
improved Same Store operations and higher earnings from recently acquired or
redeveloped properties.
Net Operating Income: U.S. Self-Storage
(Amounts in millions)
2011 2010
Same Store $ 1,034 $ 970
Acquired/redeveloped properties 69 49
Total $ 1,103 $ 1,019
Public Storage’s share $ 1,103 $ 1,019