Public Storage 2004 Annual Report Download - page 4
Download and view the complete annual report
Please find page 4 of the 2004 Public Storage annual report below. You can navigate through the pages in the report by either clicking on the pages listed below, or by using the keyword search tool below to find specific information within the annual report.-
 1
1 -
 2
2 -
 3
3 -
 4
4 -
 5
5 -
 6
6 -
 7
7 -
 8
8 -
 9
9 -
 10
10 -
 11
11 -
 12
12 -
 13
13 -
 14
14 -
 15
15 -
16
-
17
-
18
-
19
-
20
-
21
-
22
-
23
-
24
-
25
-
26
-
27
-
28
-
29
-
30
-
31
-
32
-
33
-
34
-
35
-
36
-
37
-
38
-
39
-
40
-
41
-
42
-
43
-
44
-
45
-
46
-
47
-
48
-
49
-
50
-
51
-
52
-
53
-
54
-
55
-
56
-
57
-
58
-
59
-
60
-
61
-
62
-
63
-
64
-
65
-
66
-
67
-
68
-
69
-
70
-
71
-
72
-
73
-
74
-
75
-
76
-
77
-
78
-
79
-
80
-
81
-
82
-
83
-
84
-
85
-
86
-
87
-
88
-
89
-
90
-
91
-
92
-
93
-
94
-
95
-
96
-
97
-
98
-
99
-
100
-
101
-
102
-
103
-
104
-
105
-
106
-
107
-
108
-
109
-
110
-
111
-
112
-
113
-
114
-
115
-
116
-
117
-
118
-
119
-
120
-
121
-
122
-
123
-
124
-
125
-
126
-
127
-
128
-
129
-
130
-
131
-
132
-
133
-
134
-
135
-
136
-
137
-
138
-
139
-
140
-
141
-
142
-
143
-
144
-
145
-
146
-
147
-
148
-
149
-
150
-
151
-
152
-
153
-
154
-
155
-
156
-
157
-
158
-
159
-
160
-
161
-
162
-
163
-
164
-
165
-
166
-
167
-
168
-
169
-
170
-
171
-
172
-
173
-
174
-
175
-
176
-
177
-
178
-
179
-
180
-
181
-
182
-
183
-
184
-
185
-
186
-
187
-
188
 |
 |

We had a pretty good year. Funds from operations per share increased 4.3 percent
in 2004 to $2.93 from $2.81 in 2003. See the Computation of Funds from
Operations table for a reconciliation of net income to funds from operations.
Several of the initiatives we started in 2002 are coming to fruition. In addition, we
expanded our franchise and positioned ourselves for meaningful growth in 2005. Let’s look
at what we did in 2004 and its implications for 2005.
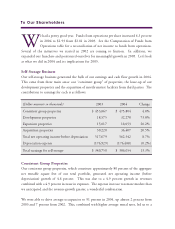
Self-Storage Business
Our self-storage business generated the bulk of our earnings and cash flow growth in 2004.
This came from three main areas: our “consistent group” of properties, the lease-up of our
development properties and the acquisition of mostly mature facilities from third parties. The
contribution to earnings for each is as follows:
(Dollar amounts in thousands) 2003 2004 Change
Consistent group properties $ 453,867 $ 475,804 4.8%
Development properties 18,575 32,278 73.8%
Expansion properties 15,017 18,053 20.2%
Acquisition properties 30,220 36,407 20.5%
Total net operating income before depreciation 517,679 562,542 8.7%
Depreciation expense (176,929) (176,488) (0.2%)
Total earnings for self-storage $ 340,750 $ 386,054 13.3%
Consistent Group Properties
Our consistent group properties, which constitute approximately 80 percent of the aggregate
net rentable square feet of our total portfolio, generated net operating income (before
depreciation) growth of 4.8 percent. This was due to a 4.9 percent growth in revenues
combined with a 4.9 percent increase in expenses. The expense increase was more modest than
we anticipated and the revenue growth greater, a wonderful combination.
We were able to drive average occupancies to 91 percent in 2004, up almost 2 percent from
2003 and 7 percent from 2002. This, combined with higher average rental rates, led us to a
To Our Shareholders