Prudential 2007 Annual Report Download - page 8
Download and view the complete annual report
Please find page 8 of the 2007 Prudential annual report below. You can navigate through the pages in the report by either clicking on the pages listed below, or by using the keyword search tool below to find specific information within the annual report.-
 1
1 -
 2
2 -
 3
3 -
 4
4 -
 5
5 -
 6
6 -
 7
7 -
 8
8 -
 9
9 -
 10
10 -
 11
11 -
 12
12 -
 13
13 -
 14
14 -
 15
15 -
 16
16 -
 17
17 -
 18
18 -
 19
19 -
20
-
21
-
22
-
23
-
24
-
25
-
26
-
27
-
28
-
29
-
30
-
31
-
32
-
33
-
34
-
35
-
36
-
37
-
38
-
39
-
40
-
41
-
42
-
43
-
44
-
45
-
46
-
47
-
48
-
49
-
50
-
51
-
52
-
53
-
54
-
55
-
56
-
57
-
58
-
59
-
60
-
61
-
62
-
63
-
64
-
65
-
66
-
67
-
68
-
69
-
70
-
71
-
72
-
73
-
74
-
75
-
76
-
77
-
78
-
79
-
80
-
81
-
82
-
83
-
84
-
85
-
86
-
87
-
88
-
89
-
90
-
91
-
92
-
93
-
94
-
95
-
96
-
97
-
98
-
99
-
100
-
101
-
102
-
103
-
104
-
105
-
106
-
107
-
108
-
109
-
110
-
111
-
112
-
113
-
114
-
115
-
116
-
117
-
118
-
119
-
120
-
121
-
122
-
123
-
124
-
125
-
126
-
127
-
128
-
129
-
130
-
131
-
132
-
133
-
134
-
135
-
136
-
137
-
138
-
139
-
140
-
141
-
142
-
143
-
144
-
145
-
146
-
147
-
148
-
149
-
150
-
151
-
152
-
153
-
154
-
155
-
156
-
157
-
158
-
159
-
160
-
161
-
162
-
163
-
164
-
165
-
166
-
167
-
168
-
169
-
170
-
171
-
172
-
173
-
174
-
175
-
176
-
177
-
178
-
179
-
180
-
181
-
182
-
183
-
184
-
185
-
186
-
187
-
188
-
189
-
190
-
191
-
192
-
193
-
194
-
195
-
196
 |
 |

Financial Services Businesses
In millions, except per share amounts
For the years ended December 31, 2007 2006 2005
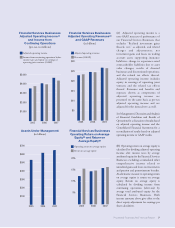
RESULTS BASED ON ADJUSTED OPERATING INCOME (A)
Revenues $ 26,659 $ 24,562 $ 22,876
Benefits and expenses 21,962 20,461 19,338
Adjusted operating income before income taxes $ 4,697 $ 4,101 $ 3,538
Operating return on average equity (B) 15.71% 14.33% 12.28%
GAAP RESULTS
Revenues $ 26,420 $ 24,456 $ 23,321
Benefits and expenses 22,024 20,465 19,529
Income from continuing operations before income taxes
and equity in earnings of operating joint ventures $ 4,396 $ 3,991 $ 3,792
Return on average equity (B) 16.20% 14.67% 15.48%
EARNINGS PER SHARE OF COMMON STOCK - diluted
Adjusted operating income after income taxes $ 7.31 $ 6.06 $ 4.81
Reconciling items:
Realized investment gains (losses), net, and related charges and adjustments 0.10 0.18 1.08
Other reconciling items 0.11 0.24 (0.17)
Tax benefit on above 0.06 (0.12) 0.76
Income from continuing operations (after-tax) $ 7.58 $ 6.36 $ 6.48
Consolidated Information
In millions, unless otherwise noted
As of or for the years ended December 31, 2007 2006 2005
GAAP RESULTS
Total revenues $ 34,401 $ 32,268 $ 31,347
Income (loss) after income taxes:
Continuing operations $ 3,687 $ 3,357 $ 3,613
Discontinued operations 17 71 (73)
Consolidated net income $ 3,704 $ 3,428 $ 3,540
Net income:
Financial Services Businesses $ 3,512 $ 3,144 $ 3,219
Closed Block Business 192 284 321
Consolidated net income $ 3,704 $ 3,428 $ 3,540
FINANCIAL POSITION
Invested assets $ 243,107 $ 235,417 $ 221,401
Total assets $ 485,814 $ 454,266 $ 413,374
Attributed equity:
Financial Services Businesses $ 22,170 $ 21,690 $ 21,654
Closed Block Business 1,287 1,202 1,109
Total equity $ 23,457 $ 22,892 $ 22,763
Assets under management (in billions) $ 648 $ 616 $ 532
FINANCIAL HIGHLIGHTS
6Prudential Financial 2007 Annual Report