Prudential 2006 Annual Report Download - page 18
Download and view the complete annual report
Please find page 18 of the 2006 Prudential annual report below. You can navigate through the pages in the report by either clicking on the pages listed below, or by using the keyword search tool below to find specific information within the annual report.-
 1
1 -
2
-
3
-
4
-
5
-
6
-
7
-
 8
8 -
 9
9 -
 10
10 -
 11
11 -
 12
12 -
 13
13 -
 14
14 -
 15
15 -
 16
16 -
 17
17 -
 18
18 -
 19
19 -
 20
20 -
 21
21 -
 22
22 -
 23
23 -
 24
24 -
 25
25 -
 26
26 -
 27
27 -
 28
28 -
29
-
30
-
31
-
32
-
33
-
34
-
35
-
36
-
37
-
38
-
39
-
40
-
41
-
42
-
43
-
44
-
45
-
46
-
47
-
48
-
49
-
50
-
51
-
52
-
53
-
54
-
55
-
56
-
57
-
58
-
59
-
60
-
61
-
62
-
63
-
64
-
65
-
66
-
67
-
68
-
69
-
70
-
71
-
72
-
73
-
74
-
75
-
76
-
77
-
78
-
79
-
80
-
81
-
82
-
83
-
84
-
85
-
86
-
87
-
88
-
89
-
90
-
91
-
92
-
93
-
94
-
95
-
96
-
97
-
98
-
99
-
100
-
101
-
102
-
103
-
104
-
105
-
106
-
107
-
108
-
109
-
110
-
111
-
112
-
113
-
114
-
115
-
116
-
117
-
118
-
119
-
120
-
121
-
122
-
123
-
124
-
125
-
126
-
127
-
128
-
129
-
130
-
131
-
132
-
133
-
134
-
135
-
136
-
137
-
138
-
139
-
140
-
141
-
142
-
143
-
144
-
145
-
146
-
147
-
148
-
149
-
150
-
151
-
152
-
153
-
154
-
155
-
156
-
157
-
158
-
159
-
160
-
161
-
162
-
163
-
164
-
165
-
166
-
167
-
168
-
169
-
170
-
171
-
172
-
173
-
174
-
175
-
176
-
177
-
178
-
179
-
180
-
181
-
182
-
183
-
184
-
185
-
186
-
187
-
188
-
189
-
190
-
191
-
192
 |
 |
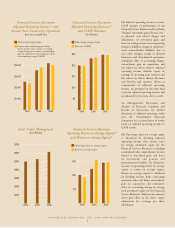
benefited from higher asset management fees as a result of increased asset values due to market appreciation and net asset flows.
Higher expenses, including performance-related compensation costs, were a partial offset.
• Financial Advisory segment results in 2006 improved in comparison to the prior year, reflecting lower expenses in 2006 related to
obligations and costs we retained in connection with the businesses contributed to the retail brokerage joint venture with Wachovia,
primarily for litigation and regulatory matters, and increased income from our 38% share of the joint venture.
• Retirement segment results for 2006 improved slightly in comparison to the prior year primarily reflecting lower acquisition-related
transition expenses, higher investment results in our institutional investment products business due principally from a larger base of
invested assets and increased fees due to higher full service retirement account values. These items were partially offset by expenses
incurred in 2006 in our full service business relating to the expansion of our distribution and client servicing capabilities and costs
associated with expense reduction initiatives, lower mortgage prepayment income and higher crediting rates on full service general
account liabilities.
• International Insurance segment results for 2006 improved in comparison to the prior year, reflecting more favorable results from
the segment’s Life Planner operations, which benefited from continued business growth and more favorable foreign currency
exchange rates. Less favorable results from the segment’s Gibraltar Life operations were a partial offset, as lower benefits from
reserve refinements, current year guaranty fund assessment costs, and a less favorable level of policy benefits and expenses more
than offset improved investment income margins and more favorable foreign currency exchange rates.
• International Investments segment results in 2006 improved in comparison to the prior year due to more favorable results from both
the segment’s global commodities business, including income representing market value changes on securities held relating to
trading exchange memberships, and its asset management operations.
• Realized investment gains (losses), net, and related adjustments for the Financial Services Businesses of $73 million in 2006
includes net losses on sales and maturities of fixed maturity securities partially offset by a gain on a private fixed maturity related to
a Korean financial services company and a recovery from a U.S. telecommunications company. In addition, results for 2006
benefited from fluctuations in value of hedging instruments related to our foreign currency risk and investments and from realized
investment gains from the sale of equity securities.
• Closed Block Business income from continuing operations before income taxes, equity in earnings of operating joint ventures,
extraordinary gain on acquisition and cumulative effect of accounting change decreased $79 million from the prior year, reflecting a
decrease in net realized investment gains, partially offset by a decrease in dividends to policyholders, which includes a decrease to
the cumulative earnings policyholder dividend obligation. Realized investment gains (losses), net in 2006 reflect lower net gains on
both sales and maturities of fixed maturity securities and sales of equity securities and losses due to fluctuations in value of
investment related hedges.
Accounting Policies & Pronouncements
Application of Critical Accounting Estimates
The preparation of financial statements in conformity with accounting principles generally accepted in the United States of America,
or U.S. GAAP, requires the application of accounting policies that often involve a significant degree of judgment. Management, on an
ongoing basis, reviews estimates and assumptions used in the preparation of financial statements. If management determines that
modifications in assumptions and estimates are appropriate given current facts and circumstances, results of operations and financial
position as reported in the Consolidated Financial Statements could change significantly.
The following sections discuss the accounting policies applied in preparing our financial statements that management believes are
most dependent on the application of estimates and assumptions.
Valuation of Investments
As prescribed by U.S. GAAP, we present our investments classified as available for sale, including fixed maturity and equity
securities, and our investments classified as trading, such as our trading account assets supporting insurance liabilities, at fair value in the
statements of financial position. The fair values for our public fixed maturity securities and our public equity securities are based on quoted
market prices or prices obtained from independent pricing services. However, for our investments in private securities such as private
placement fixed maturity securities, which comprise 15% of our investments as of December 31, 2006, this information is not available.
For these private fixed maturities, fair value is determined typically by using a discounted cash flow model, which relies upon the average
of spread surveys collected from private market intermediaries who are active in both primary and secondary transactions and takes into
account, among other factors, the credit quality of the issuer and the reduced liquidity associated with private placements. The estimated
fair value of certain non-performing private placement fixed maturities is based on our own estimates. See “—Realized Investment Gains
and General Account Investments—General Account Investments—Fixed Maturity Securities—Private Fixed Maturities—Credit Quality”
and “—Realized Investment Gains and General Account Investments—General Account Investments—Trading Account Assets Supporting
Insurance Liabilities” for information regarding the credit quality of the private fixed maturity securities included in our general account.
For our investments classified as available for sale, the impact of changes in fair value is recorded as an unrealized gain or loss in
“Accumulated other comprehensive income (loss), net,” a separate component of equity. For our investments classified as trading, the
impact of changes in fair value is recorded within “Asset management fees and other income.” In addition, investments classified as
PRUDENTIAL FINANCIAL, INC. 2006 ANNUAL REPORT
16